ESP32 - DIYables Bluetooth App Plotter

Overview

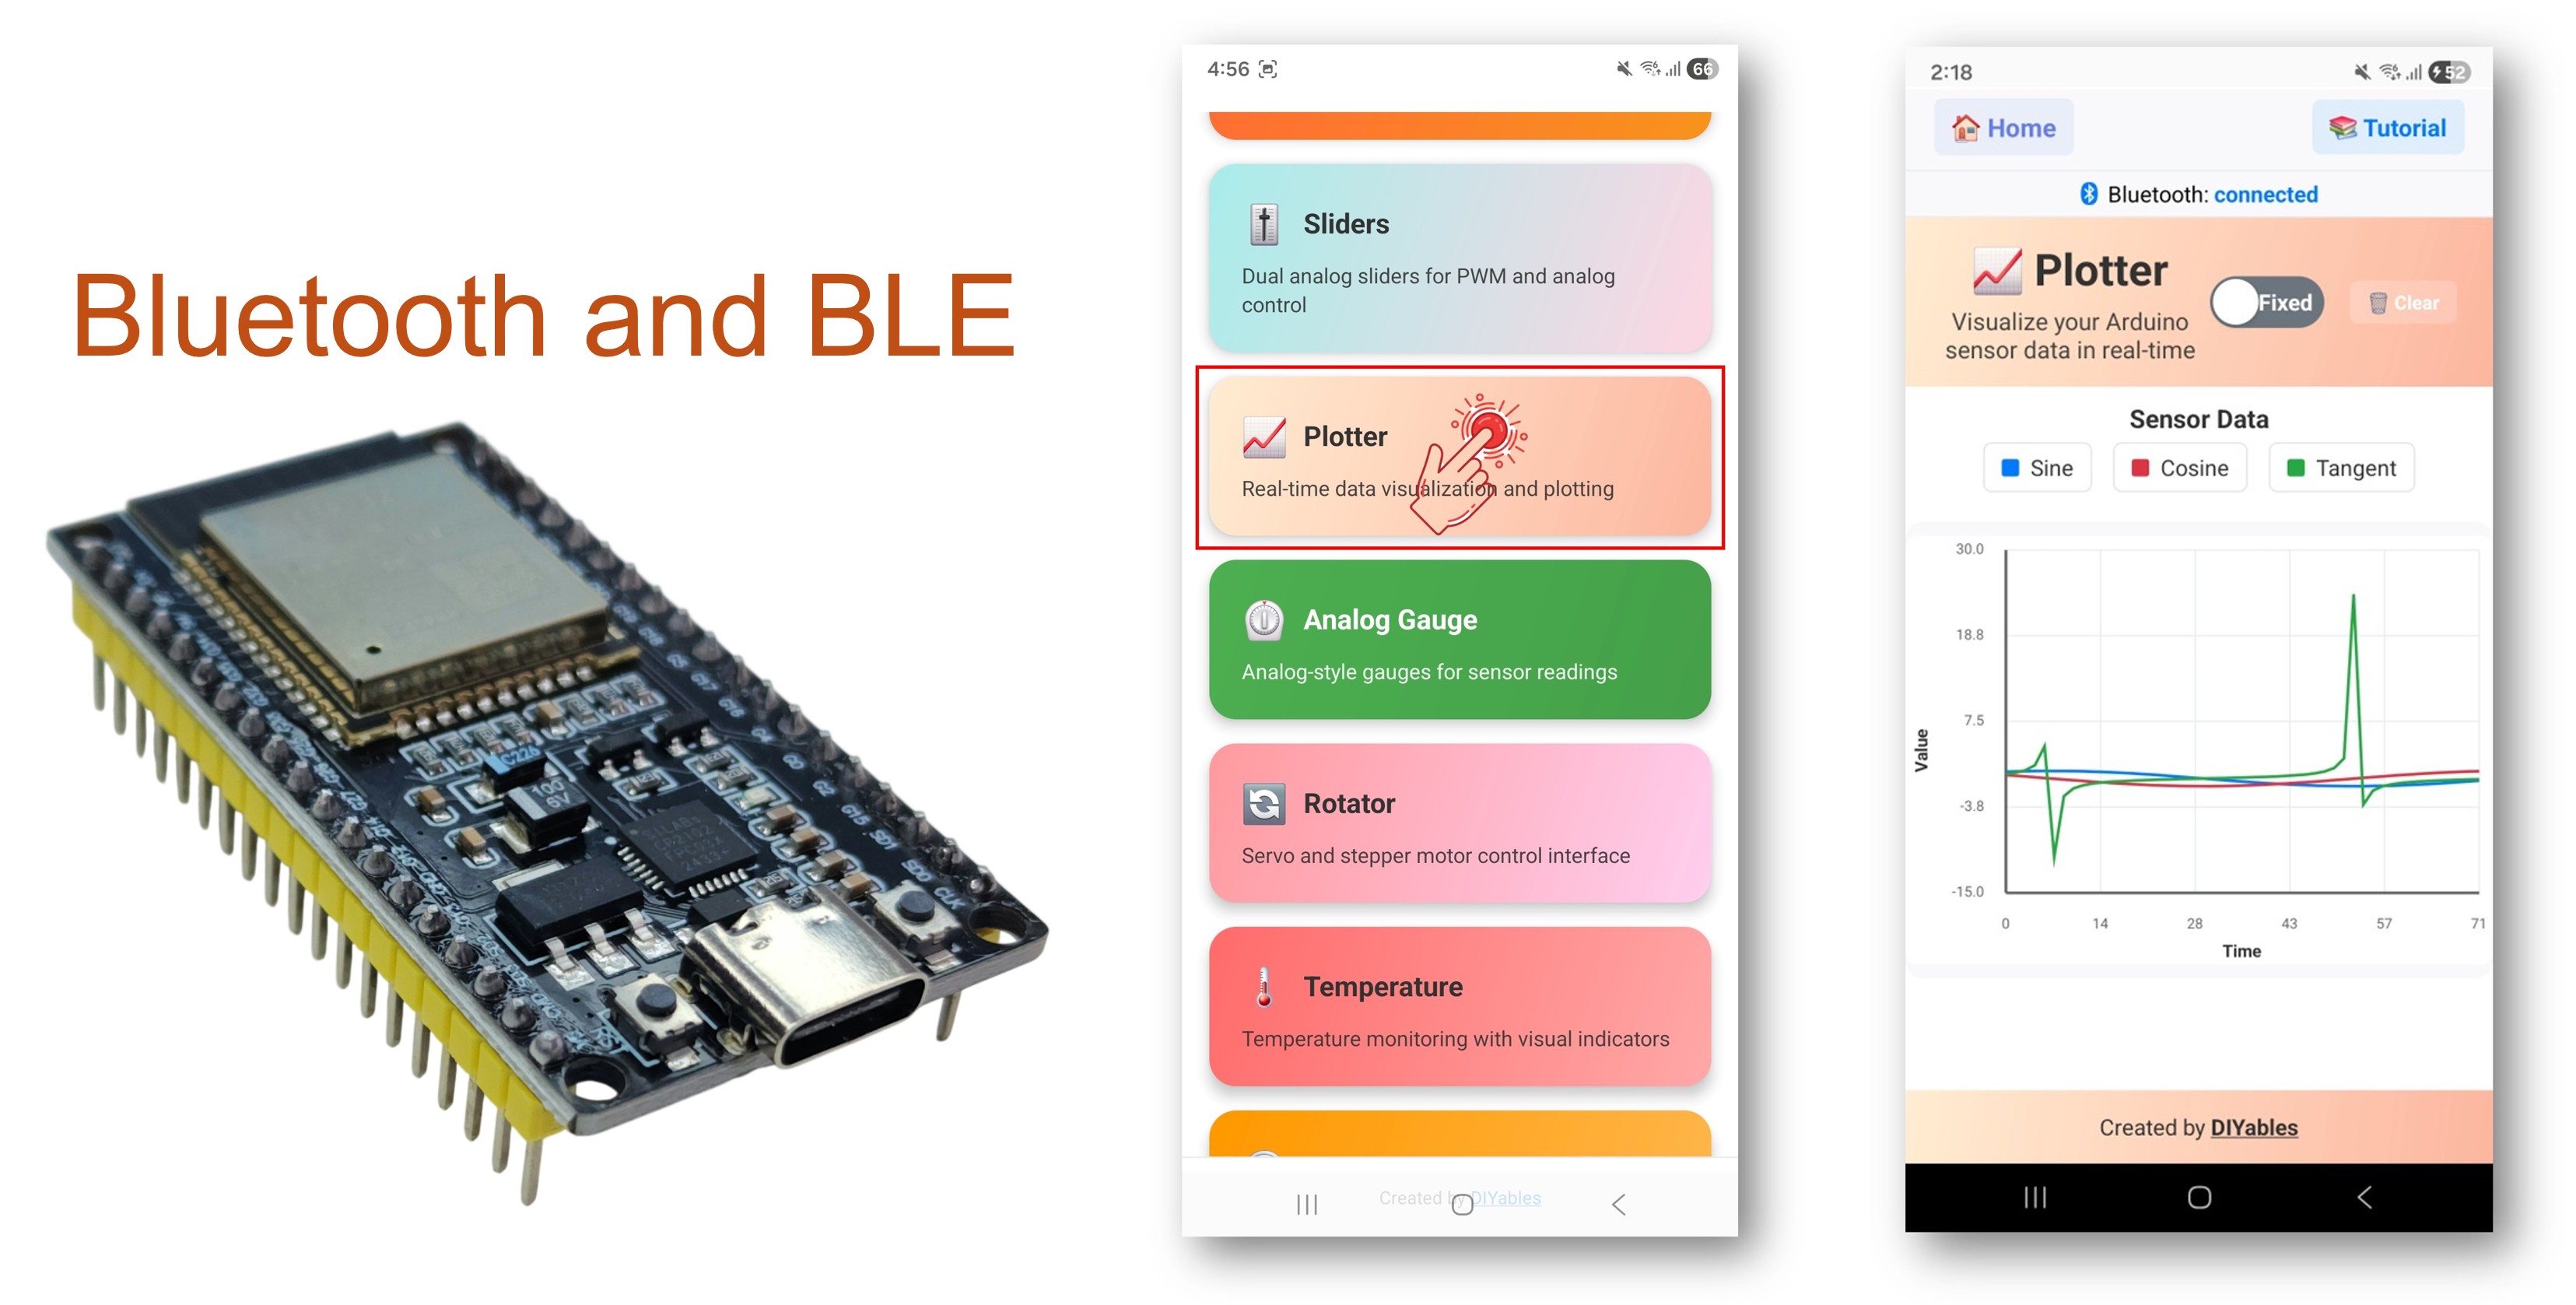
The Bluetooth Plotter example provides real-time data plotting on your smartphone through the DIYables Bluetooth STEM app. Designed for ESP32 boards with support for both BLE (Bluetooth Low Energy) and Classic Bluetooth connections. Plot up to 10 data series simultaneously with configurable axes, auto-scaling, legend labels, and scrolling display — perfect for sensor visualization, signal analysis, and data monitoring.

This example supports two Bluetooth modes:

  • ESP32 BLE (Bluetooth Low Energy): Works on both Android and iOS
  • ESP32 Classic Bluetooth: Works on Android only. iOS does not support Classic Bluetooth. Use BLE if you need iOS support.
ESP32 Bluetooth Plotter Example - Real-Time Data Plotting Interface Tutorial

Features

  • Multi-Series Plotting: Plot up to 10 data series simultaneously
  • Real-Time Display: Continuous scrolling graph with live updates
  • Configurable Axes: Set custom Y-axis range, axis labels, and plot title
  • Auto-Scale: Automatically adjust Y-axis range to fit data
  • Custom Legends: Label each data series for easy identification
  • Adjustable Samples: Configure number of visible data points
  • BLE & Classic Bluetooth: Choose the Bluetooth mode that suits your project
  • Cross-Platform: BLE mode works on both Android and iOS; Classic Bluetooth works on Android

Hardware Used In This Tutorial

1×ESP-WROOM-32 Dev Module
1×Alternatively, ESP32 Uno-form board
1×Alternatively, ESP32 S3 Uno-form board
1×USB Cable Type-A to Type-C (for USB-A PC)
1×USB Cable Type-C to Type-C (for USB-C PC)
1×Breadboard
1×Jumper Wires
1×Recommended: Screw Terminal Expansion Board for ESP32
1×Recommended: Breakout Expansion Board for ESP32
1×Recommended: Power Splitter for ESP32

Or you can buy the following kits:

1×DIYables ESP32 Starter Kit (ESP32 included)
1×DIYables Sensor Kit (18 sensors/displays)
Disclosure: Some of the links in this section are Amazon affiliate links, meaning we may earn a commission at no additional cost to you if you make a purchase through them. Additionally, some links direct you to products from our own brand, DIYables .

ESP32 Code

Quick Instructions

Follow these instructions step by step:

  • If this is your first time using the ESP32, refer to the tutorial on setting up the environment for ESP32 in the Arduino IDE.
  • Connect the ESP32 board to your computer using a USB cable.
  • Launch the Arduino IDE on your computer.
  • Select the appropriate ESP32 board and COM port.
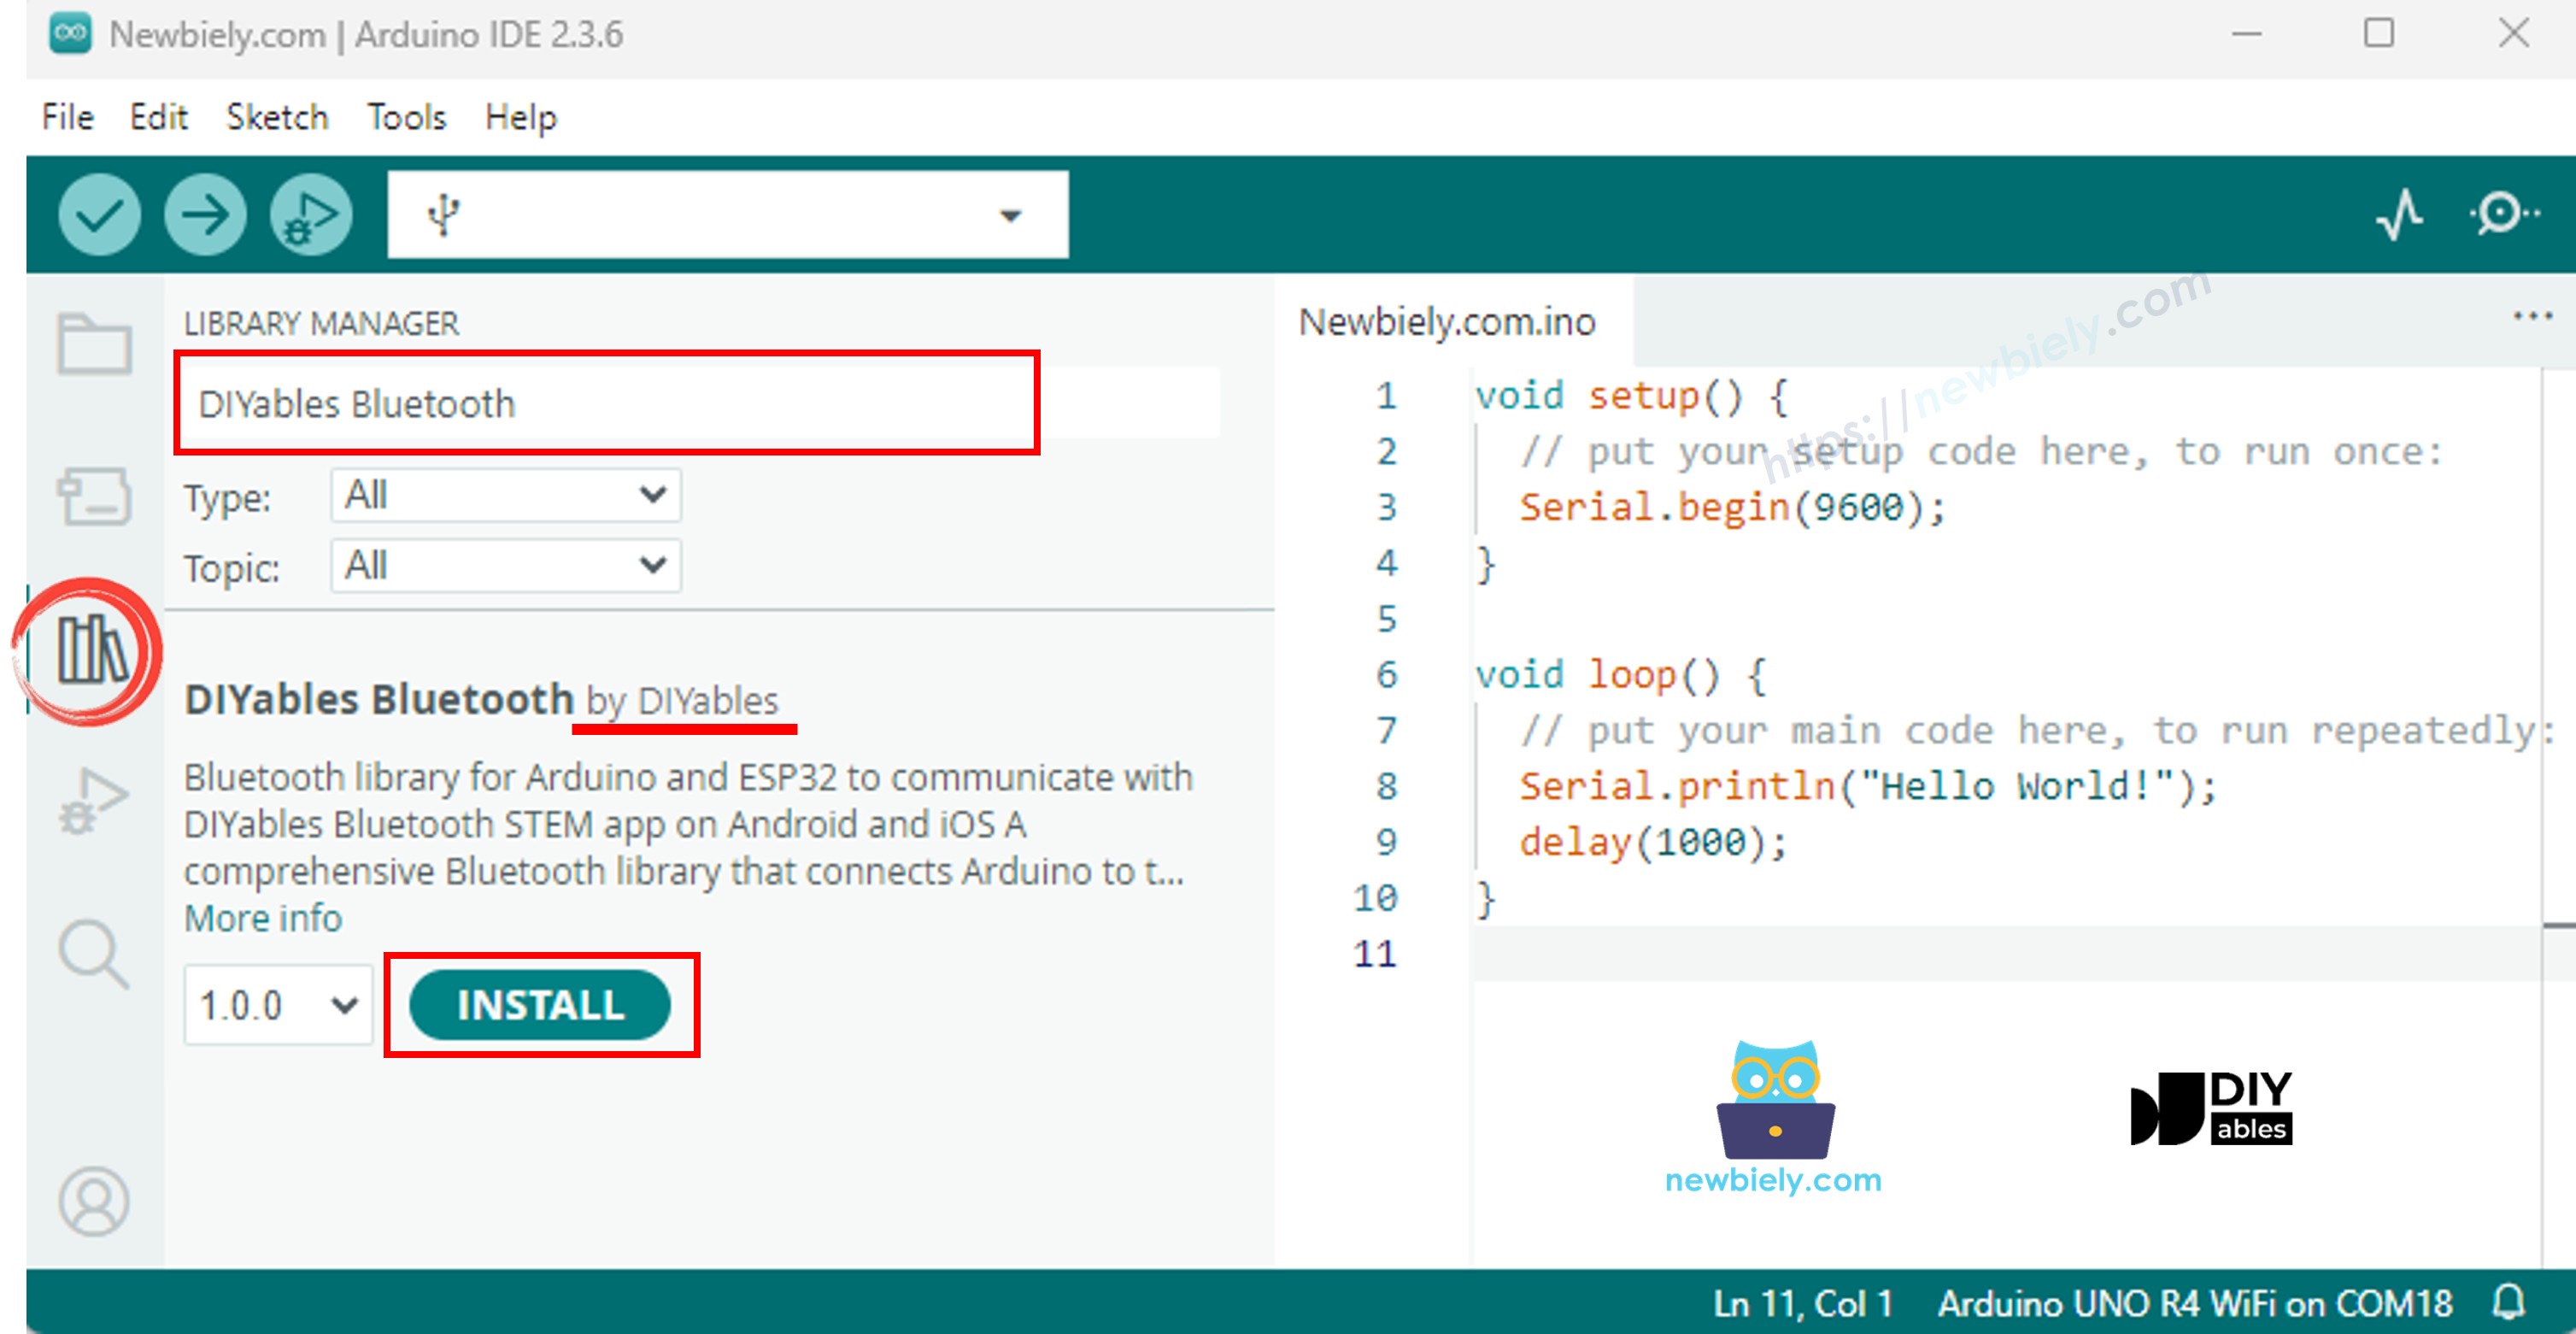
  • Navigate to the Libraries icon on the left bar of the Arduino IDE.
  • Search "DIYables Bluetooth", then find the DIYables Bluetooth library by DIYables
  • Click Install button to install the library.
ESP32 DIYables Bluetooth library
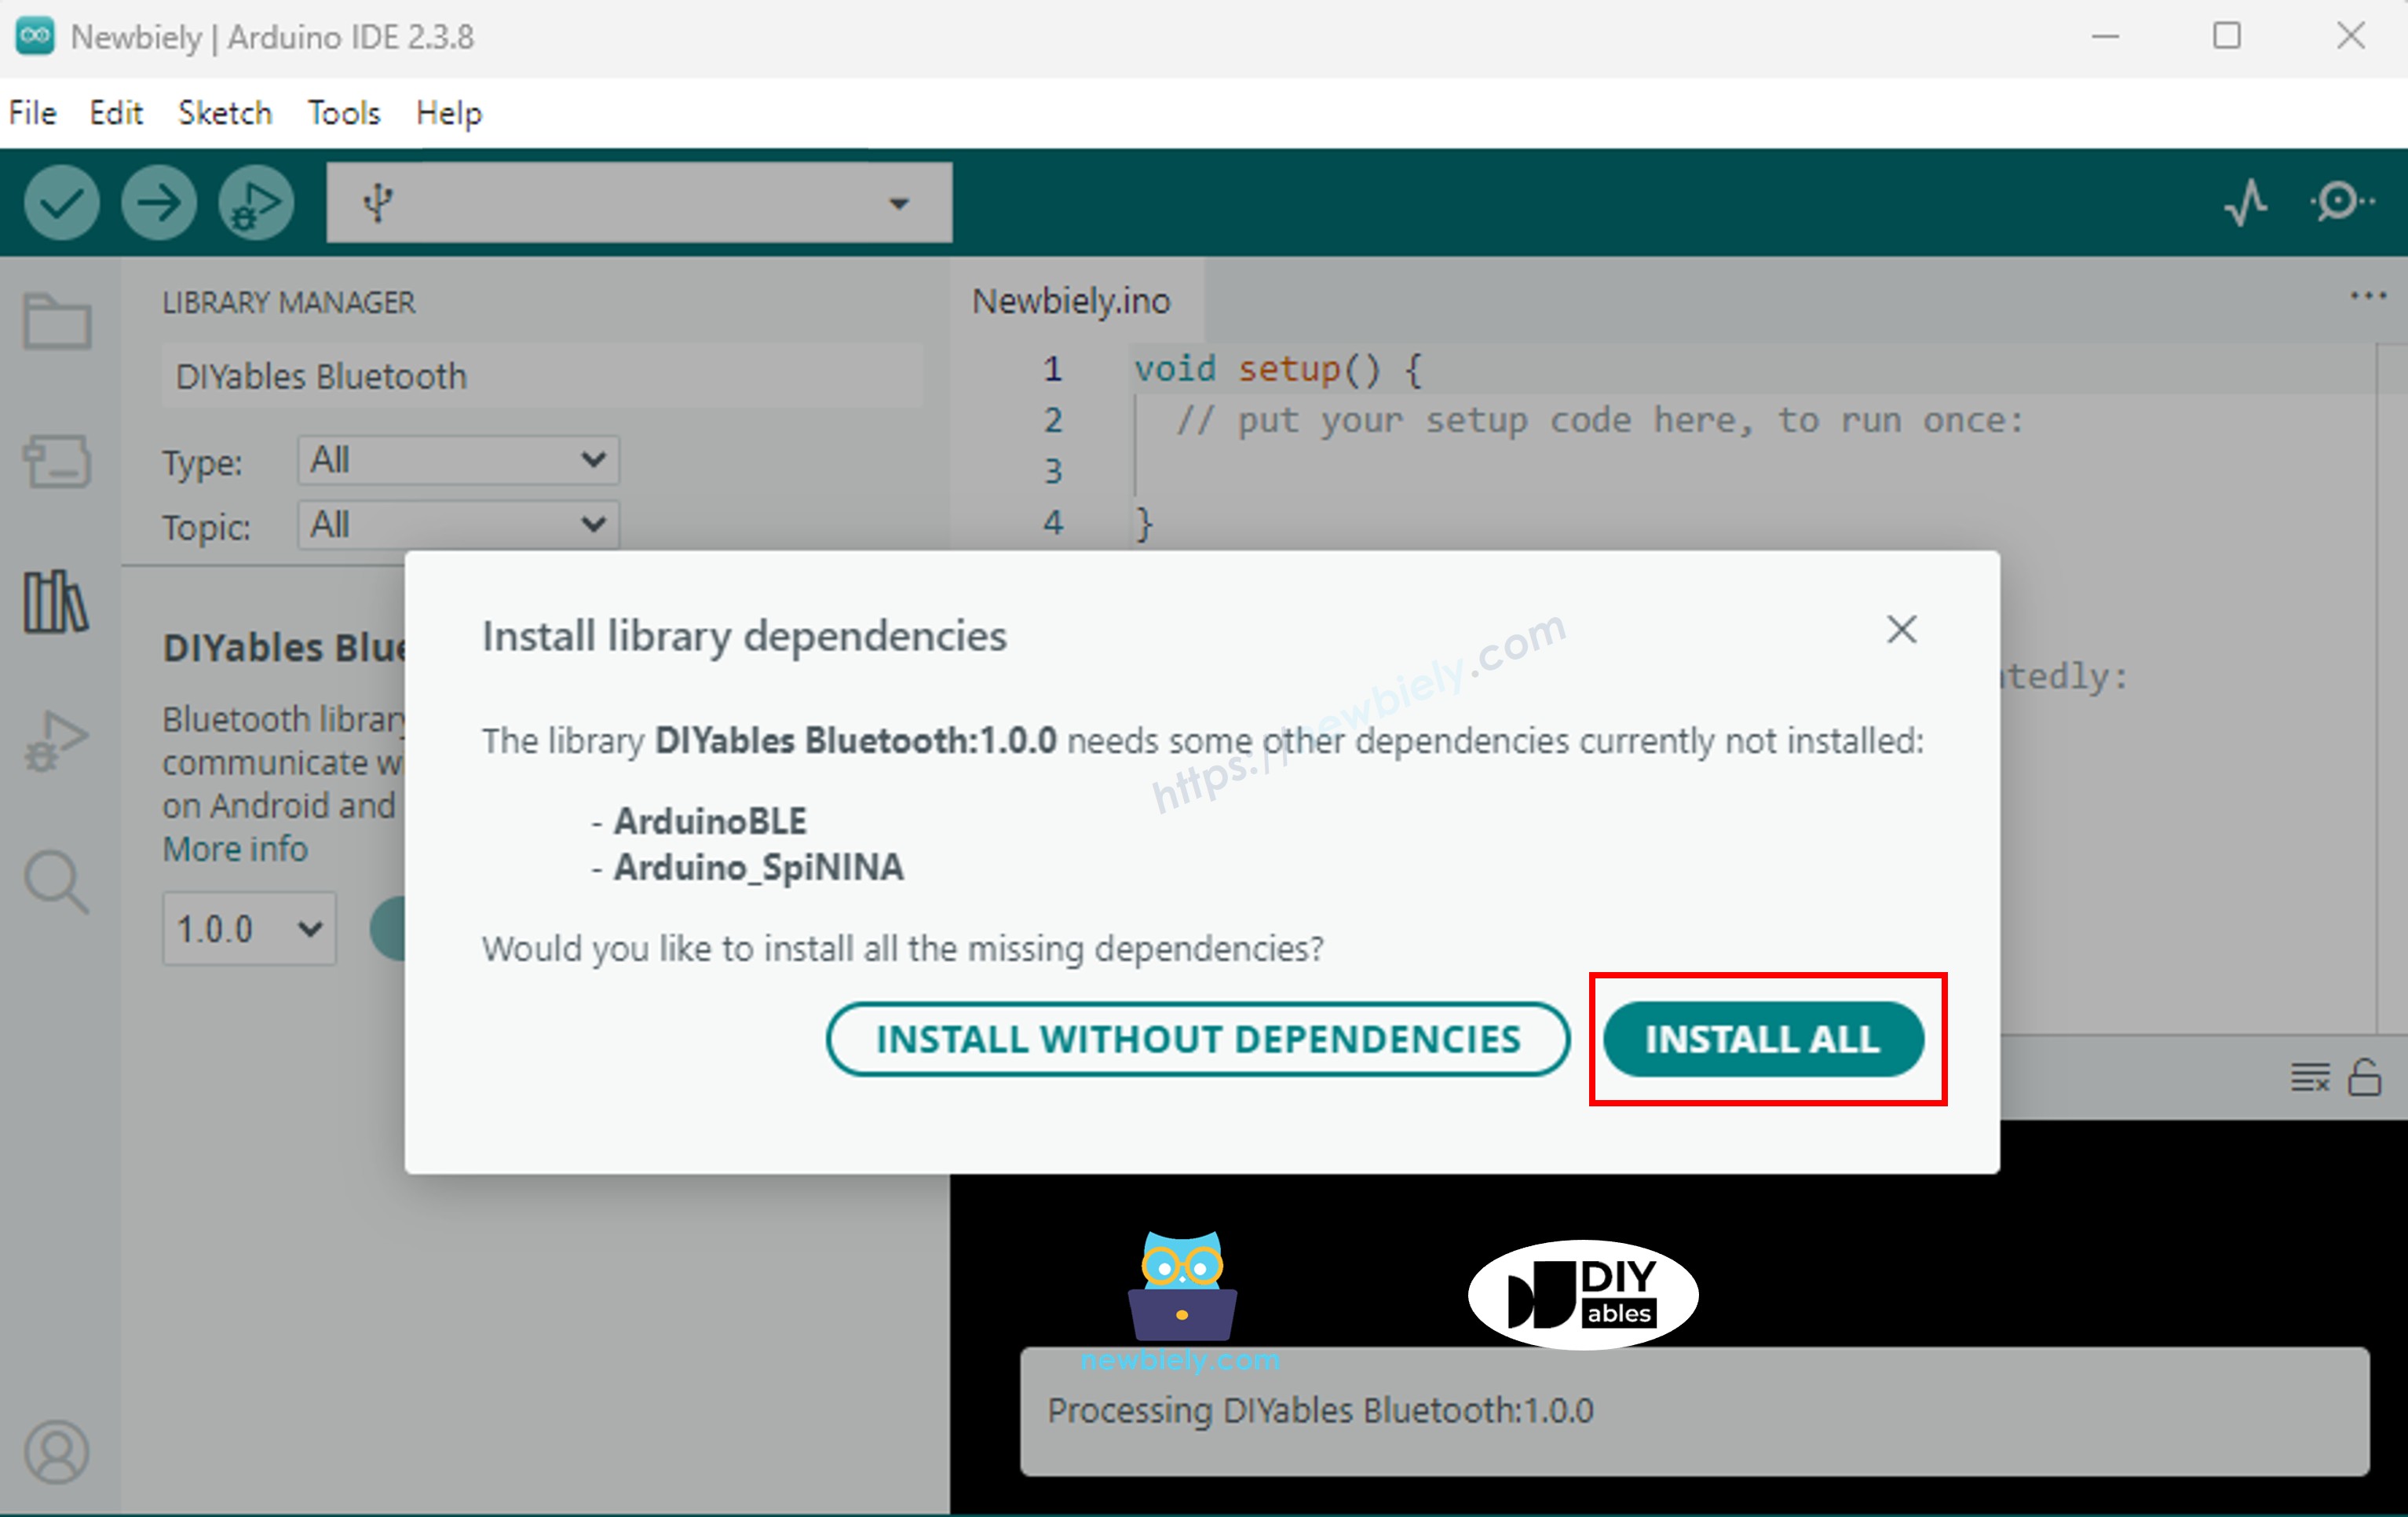
  • You will be asked for installing some other library dependencies
  • Click Install All button to install all library dependencies.
ESP32 DIYables Bluetooth dependency

Choose one of the two Bluetooth modes below depending on your needs:

ESP32 Classic Bluetooth Code (works with app on Android only)

Note: Classic Bluetooth is NOT supported on iOS. If you need iOS support, use the BLE code below.

  • On Arduino IDE, Go to File Examples DIYables Bluetooth Esp32Bluetooth_Plotter example, or copy the above code and paste it to the editor of Arduino IDE
/* * DIYables Bluetooth Library - ESP32 Classic Bluetooth Plotter Example * Works with DIYables Bluetooth STEM app on Android * Note: Classic Bluetooth is NOT supported on iOS. Use BLE examples for iOS support. * * This example demonstrates the Bluetooth Plotter feature: * - Real-time data plotting via Bluetooth * - Plot multiple data series simultaneously * - Configurable plot settings * * Compatible Boards: * - ESP32 (all variants with Classic Bluetooth) * - ESP32-WROOM-32 * - ESP32-DevKitC * - ESP32-WROVER * * Note: Select "Huge APP (3MB No OTA/1MB SPIFFS)" partition scheme * in Arduino IDE: Tools > Partition Scheme * * Setup: * 1. Upload the sketch to your ESP32 * 2. Open Serial Monitor (115200 baud) to see connection status * 3. Use DIYables Bluetooth App to connect and view the plot * * Tutorial: https://diyables.io/bluetooth-app * Author: DIYables */ #include <DIYables_BluetoothServer.h> #include <DIYables_BluetoothPlotter.h> #include <platforms/DIYables_Esp32Bluetooth.h> // Create Bluetooth instances DIYables_Esp32Bluetooth bluetooth("ESP32_Plotter"); DIYables_BluetoothServer bluetoothServer(bluetooth); // Create Plotter app instance DIYables_BluetoothPlotter bluetoothPlotter; // Variables for generating sample data unsigned long lastPlotTime = 0; const unsigned long PLOT_INTERVAL = 100; // Plot every 100ms float phase = 0; void setup() { Serial.begin(115200); delay(1000); Serial.println("DIYables Bluetooth - ESP32 Plotter Example"); // Initialize Bluetooth server with platform-specific implementation bluetoothServer.begin(); // Add plotter app to server bluetoothServer.addApp(&bluetoothPlotter); // Configure plotter settings bluetoothPlotter.setPlotTitle("Sensor Data"); bluetoothPlotter.setAxisLabels("Time", "Value"); bluetoothPlotter.setYAxisRange(-15, 30); // Fixed range bluetoothPlotter.setMaxSamples(100); // Show last 100 samples bluetoothPlotter.setLegendLabels("Sine", "Cosine", "Tangent"); // Custom legend labels // Uncomment to enable auto-scaling instead of fixed range: // bluetoothPlotter.enableAutoScale(true); // Set up connection event callbacks bluetoothServer.setOnConnected([]() { Serial.println("Bluetooth connected!"); }); bluetoothServer.setOnDisconnected([]() { Serial.println("Bluetooth disconnected!"); }); // Optional: Handle requests for current plot data (when app loads) bluetoothPlotter.onDataRequest([]() { Serial.println("App requested plot data"); }); Serial.println("Waiting for Bluetooth connection..."); } void loop() { // Handle Bluetooth server communications bluetoothServer.loop(); // Send plot data at regular intervals if (millis() - lastPlotTime >= PLOT_INTERVAL) { lastPlotTime = millis(); // Generate sample data (sine and cosine waves) float sine = sin(phase); float cosine = cos(phase); float tangent = tan(phase) * 0.3; // Scaled down // Send data to Bluetooth plotter (multiple series) bluetoothPlotter.send(sine, cosine, tangent); // Also print to Serial for Arduino IDE Serial Plotter comparison Serial.print(sine, 2); Serial.print(" "); Serial.print(cosine, 2); Serial.print(" "); Serial.println(tangent, 2); phase += 0.1; if (phase > 2 * PI) { phase = 0; } // TODO: Replace sample data with your actual sensor readings // Examples: // - Temperature sensor: bluetoothPlotter.send(temperature); // - Accelerometer: bluetoothPlotter.send(accelX, accelY, accelZ); // - Multiple sensors: bluetoothPlotter.send(sensor1, sensor2, sensor3); } delay(10); }
  • Click Upload button on Arduino IDE to upload code to ESP32
  • Open the Serial Monitor
  • Check out the result on Serial Monitor. It looks like the below:
COM6
Send
DIYables Bluetooth - ESP32 Plotter Example Waiting for Bluetooth connection...
Autoscroll Show timestamp
Clear output
9600 baud  
Newline  

ESP32 BLE Code (works with app on both Android and iOS)

  • On Arduino IDE, Go to File Examples DIYables Bluetooth Esp32BLE_Plotter example, or copy the above code and paste it to the editor of Arduino IDE
/* * DIYables Bluetooth Library - ESP32 BLE Plotter Example * Works with DIYables Bluetooth STEM app on Android and iOS * * This example demonstrates the Bluetooth Plotter feature: * - Real-time data plotting via Bluetooth * - Plot multiple data series simultaneously * - Configurable plot settings * * Compatible Boards: * - ESP32-WROOM-32 * - ESP32-DevKitC * - ESP32-WROVER * - ESP32-S3 * - ESP32-C3 * - Any ESP32 board supporting BLE * * Note: Select "Huge APP (3MB No OTA/1MB SPIFFS)" partition scheme * in Arduino IDE: Tools > Partition Scheme * * Setup: * 1. Upload the sketch to your ESP32 * 2. Open Serial Monitor (115200 baud) to see connection status * 3. Use DIYables Bluetooth App to connect and view the plot * * Tutorial: https://diyables.io/bluetooth-app * Author: DIYables */ #include <DIYables_BluetoothServer.h> #include <DIYables_BluetoothPlotter.h> #include <platforms/DIYables_Esp32BLE.h> // BLE Configuration const char* DEVICE_NAME = "ESP32BLE_Plotter"; const char* SERVICE_UUID = "19B10000-E8F2-537E-4F6C-D104768A1214"; const char* TX_UUID = "19B10001-E8F2-537E-4F6C-D104768A1214"; const char* RX_UUID = "19B10002-E8F2-537E-4F6C-D104768A1214"; // Create Bluetooth instances DIYables_Esp32BLE bluetooth(DEVICE_NAME, SERVICE_UUID, TX_UUID, RX_UUID); DIYables_BluetoothServer bluetoothServer(bluetooth); // Create Plotter app instance DIYables_BluetoothPlotter bluetoothPlotter; // Variables for generating sample data unsigned long lastPlotTime = 0; const unsigned long PLOT_INTERVAL = 100; float phase = 0; void setup() { Serial.begin(115200); delay(1000); Serial.println("DIYables Bluetooth - ESP32 BLE Plotter Example"); // Initialize Bluetooth server with platform-specific implementation bluetoothServer.begin(); // Add plotter app to server bluetoothServer.addApp(&bluetoothPlotter); // Configure plotter settings bluetoothPlotter.setPlotTitle("Sensor Data"); bluetoothPlotter.setAxisLabels("Time", "Value"); bluetoothPlotter.setYAxisRange(-15, 30); bluetoothPlotter.setMaxSamples(100); bluetoothPlotter.setLegendLabels("Sine", "Cosine", "Tangent"); // Set up connection event callbacks bluetoothServer.setOnConnected([]() { Serial.println("Bluetooth connected!"); }); bluetoothServer.setOnDisconnected([]() { Serial.println("Bluetooth disconnected!"); }); bluetoothPlotter.onDataRequest([]() { Serial.println("App requested plot data"); }); Serial.println("Waiting for Bluetooth connection..."); } void loop() { bluetoothServer.loop(); if (millis() - lastPlotTime >= PLOT_INTERVAL) { lastPlotTime = millis(); float sine = sin(phase); float cosine = cos(phase); float tangent = tan(phase) * 0.3; bluetoothPlotter.send(sine, cosine, tangent); Serial.print(sine, 2); Serial.print(" "); Serial.print(cosine, 2); Serial.print(" "); Serial.println(tangent, 2); phase += 0.1; if (phase > 2 * PI) { phase = 0; } } delay(10); }
  • Click Upload button on Arduino IDE to upload code to ESP32
  • Open the Serial Monitor
  • Check out the result on Serial Monitor. It looks like the below:
COM6
Send
DIYables Bluetooth - ESP32 BLE Plotter Example Waiting for Bluetooth connection...
Autoscroll Show timestamp
Clear output
9600 baud  
Newline  

Mobile App

  • Install the DIYables Bluetooth App on your smartphone: Android | iOS
  • If you are using the ESP32 Classic Bluetooth code, you need to pair the ESP32 with your Android phone before opening the app:
    • Go to your phone's Settings > Bluetooth
    • Make sure Bluetooth is turned on
    • Your phone will scan for available devices
    • Find and tap "ESP32_Plotter" in the list of available devices
    • Confirm the pairing request (no PIN required)
    • Wait until it shows "Paired" under the device name
  • If you are using the ESP32 BLE code, no pairing is needed. Just proceed to the next step.
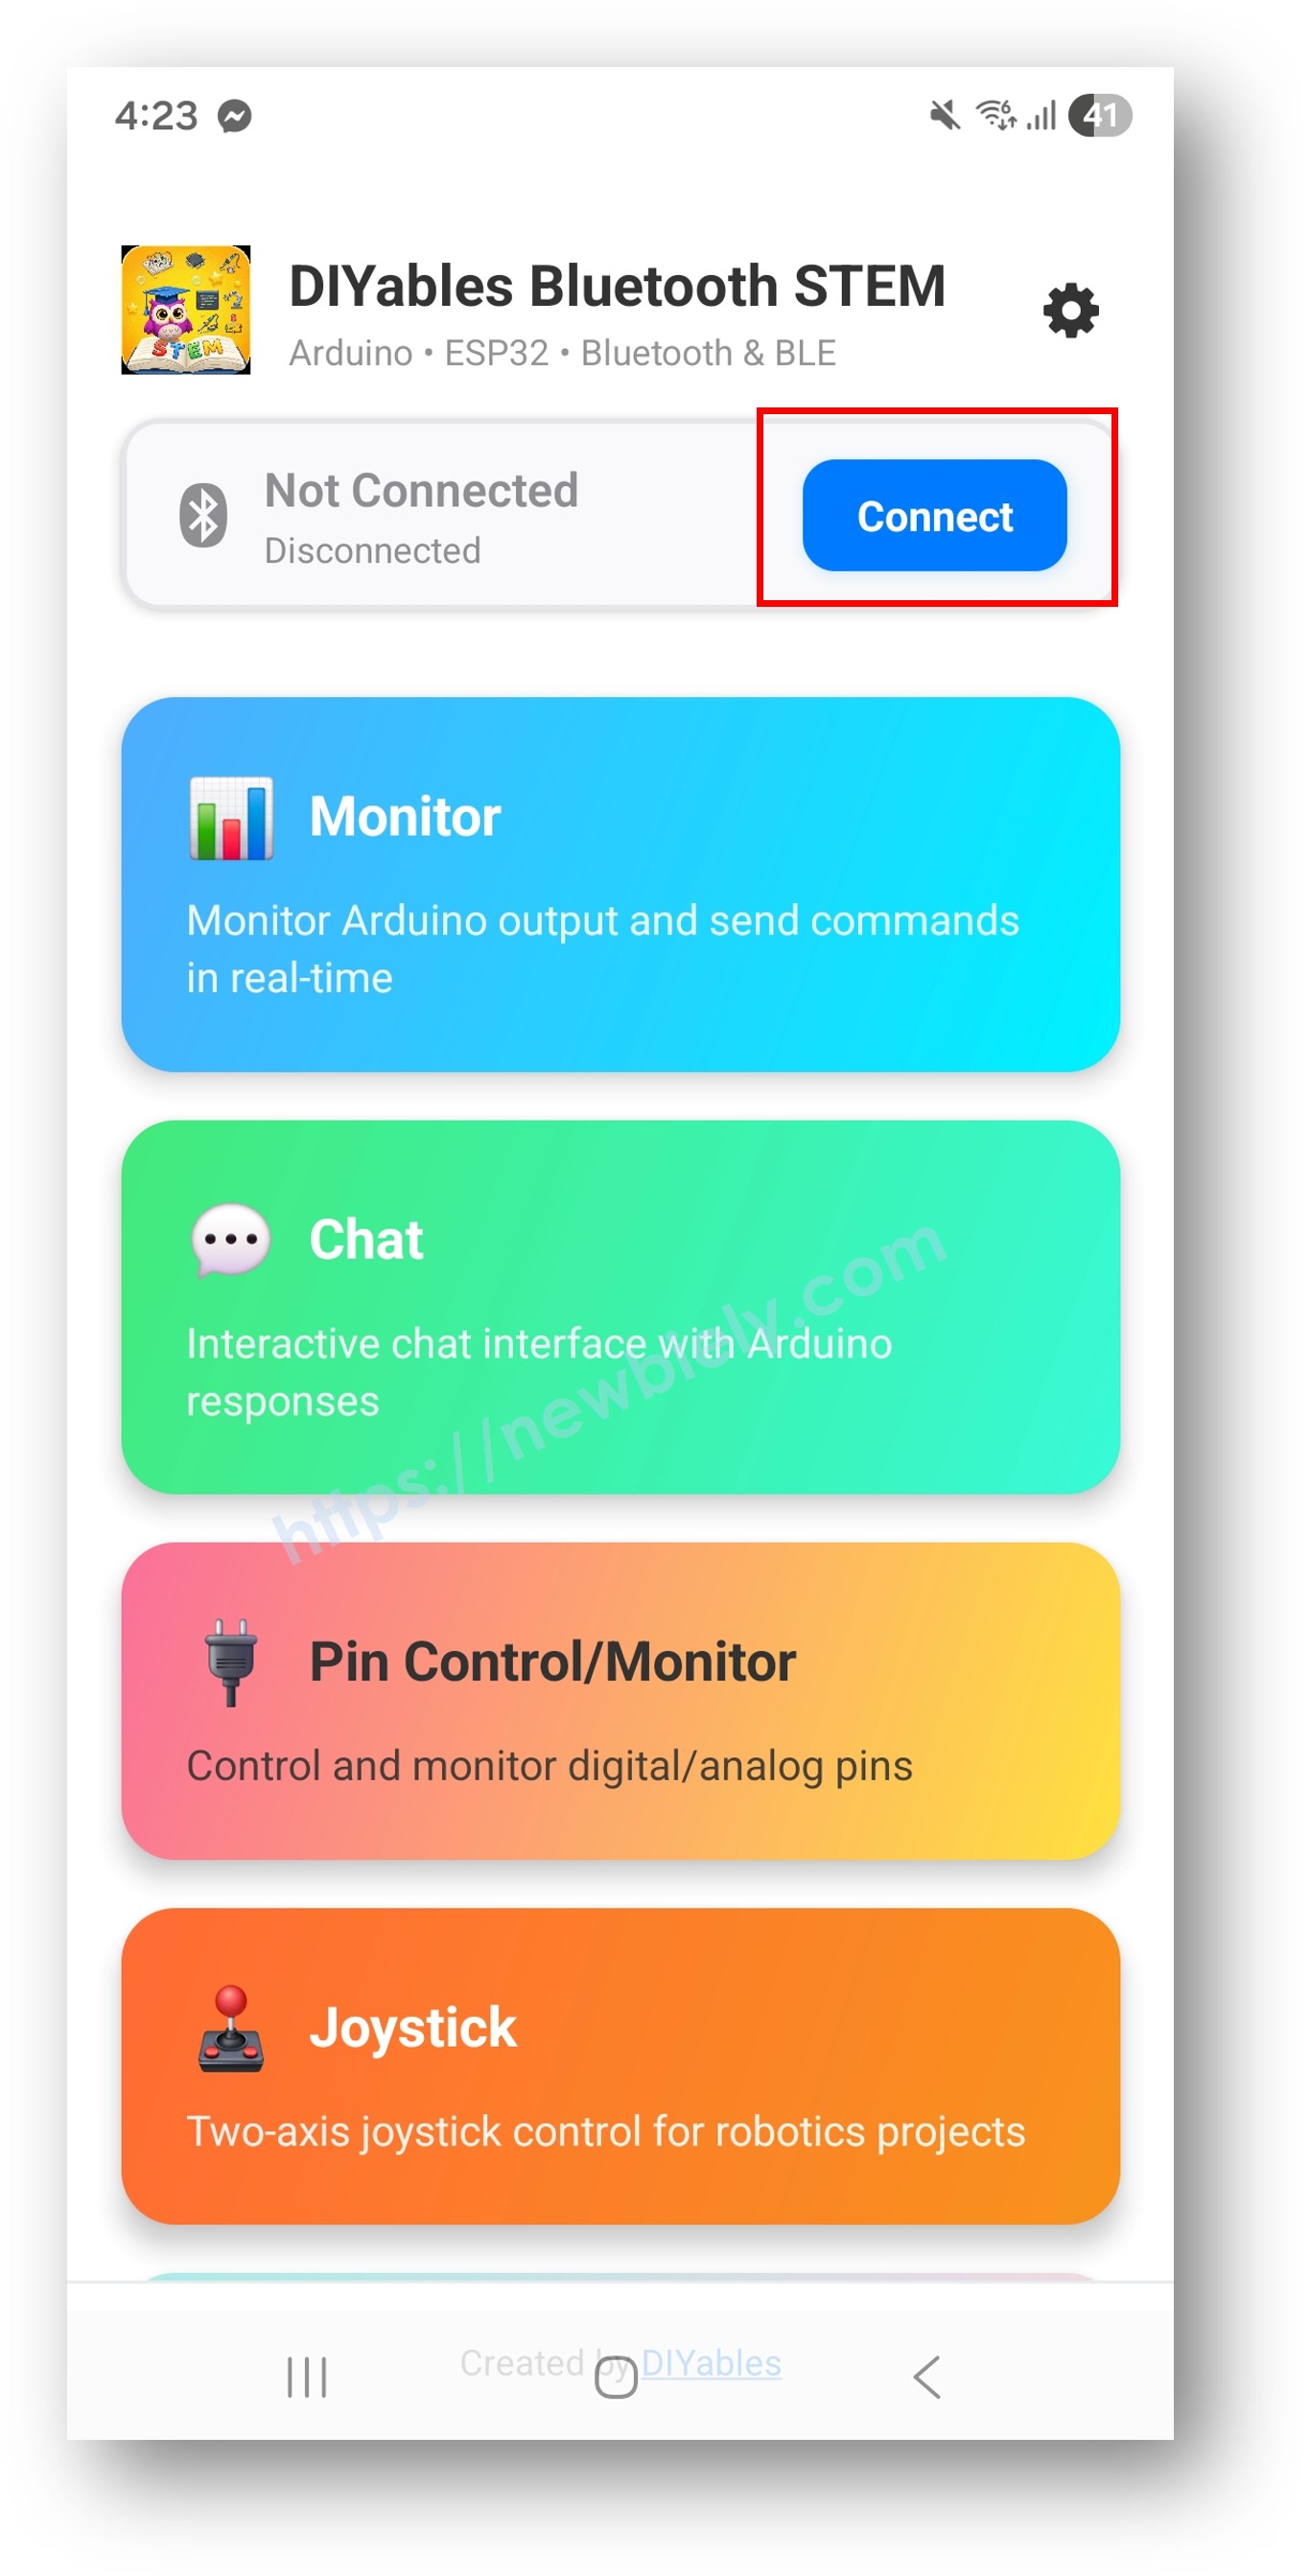
  • Open the DIYables Bluetooth App
  • When opening the app for the first time, it will ask for permissions. Please grant the following:
    • Nearby Devices permission (Android 12+) / Bluetooth permission (iOS) - required to scan and connect to Bluetooth devices
    • Location permission (Android 11 and below only) - required by older Android versions to scan for BLE devices
  • Make sure Bluetooth is turned on on your phone
  • On the home screen, tap the Connect button. The app will scan for both BLE and Classic Bluetooth devices.
DIYables Bluetooth App - Home Screen with Scan Button
  • Find and tap your device in the scan results to connect:
    • For Classic Bluetooth: tap "ESP32_Plotter"
    • For BLE: tap "ESP32BLE_Plotter"
  • Once connected, the app automatically goes back to the home screen. Select the Plotter app from the app menu.
DIYables Bluetooth App - Home Screen with Plotter App

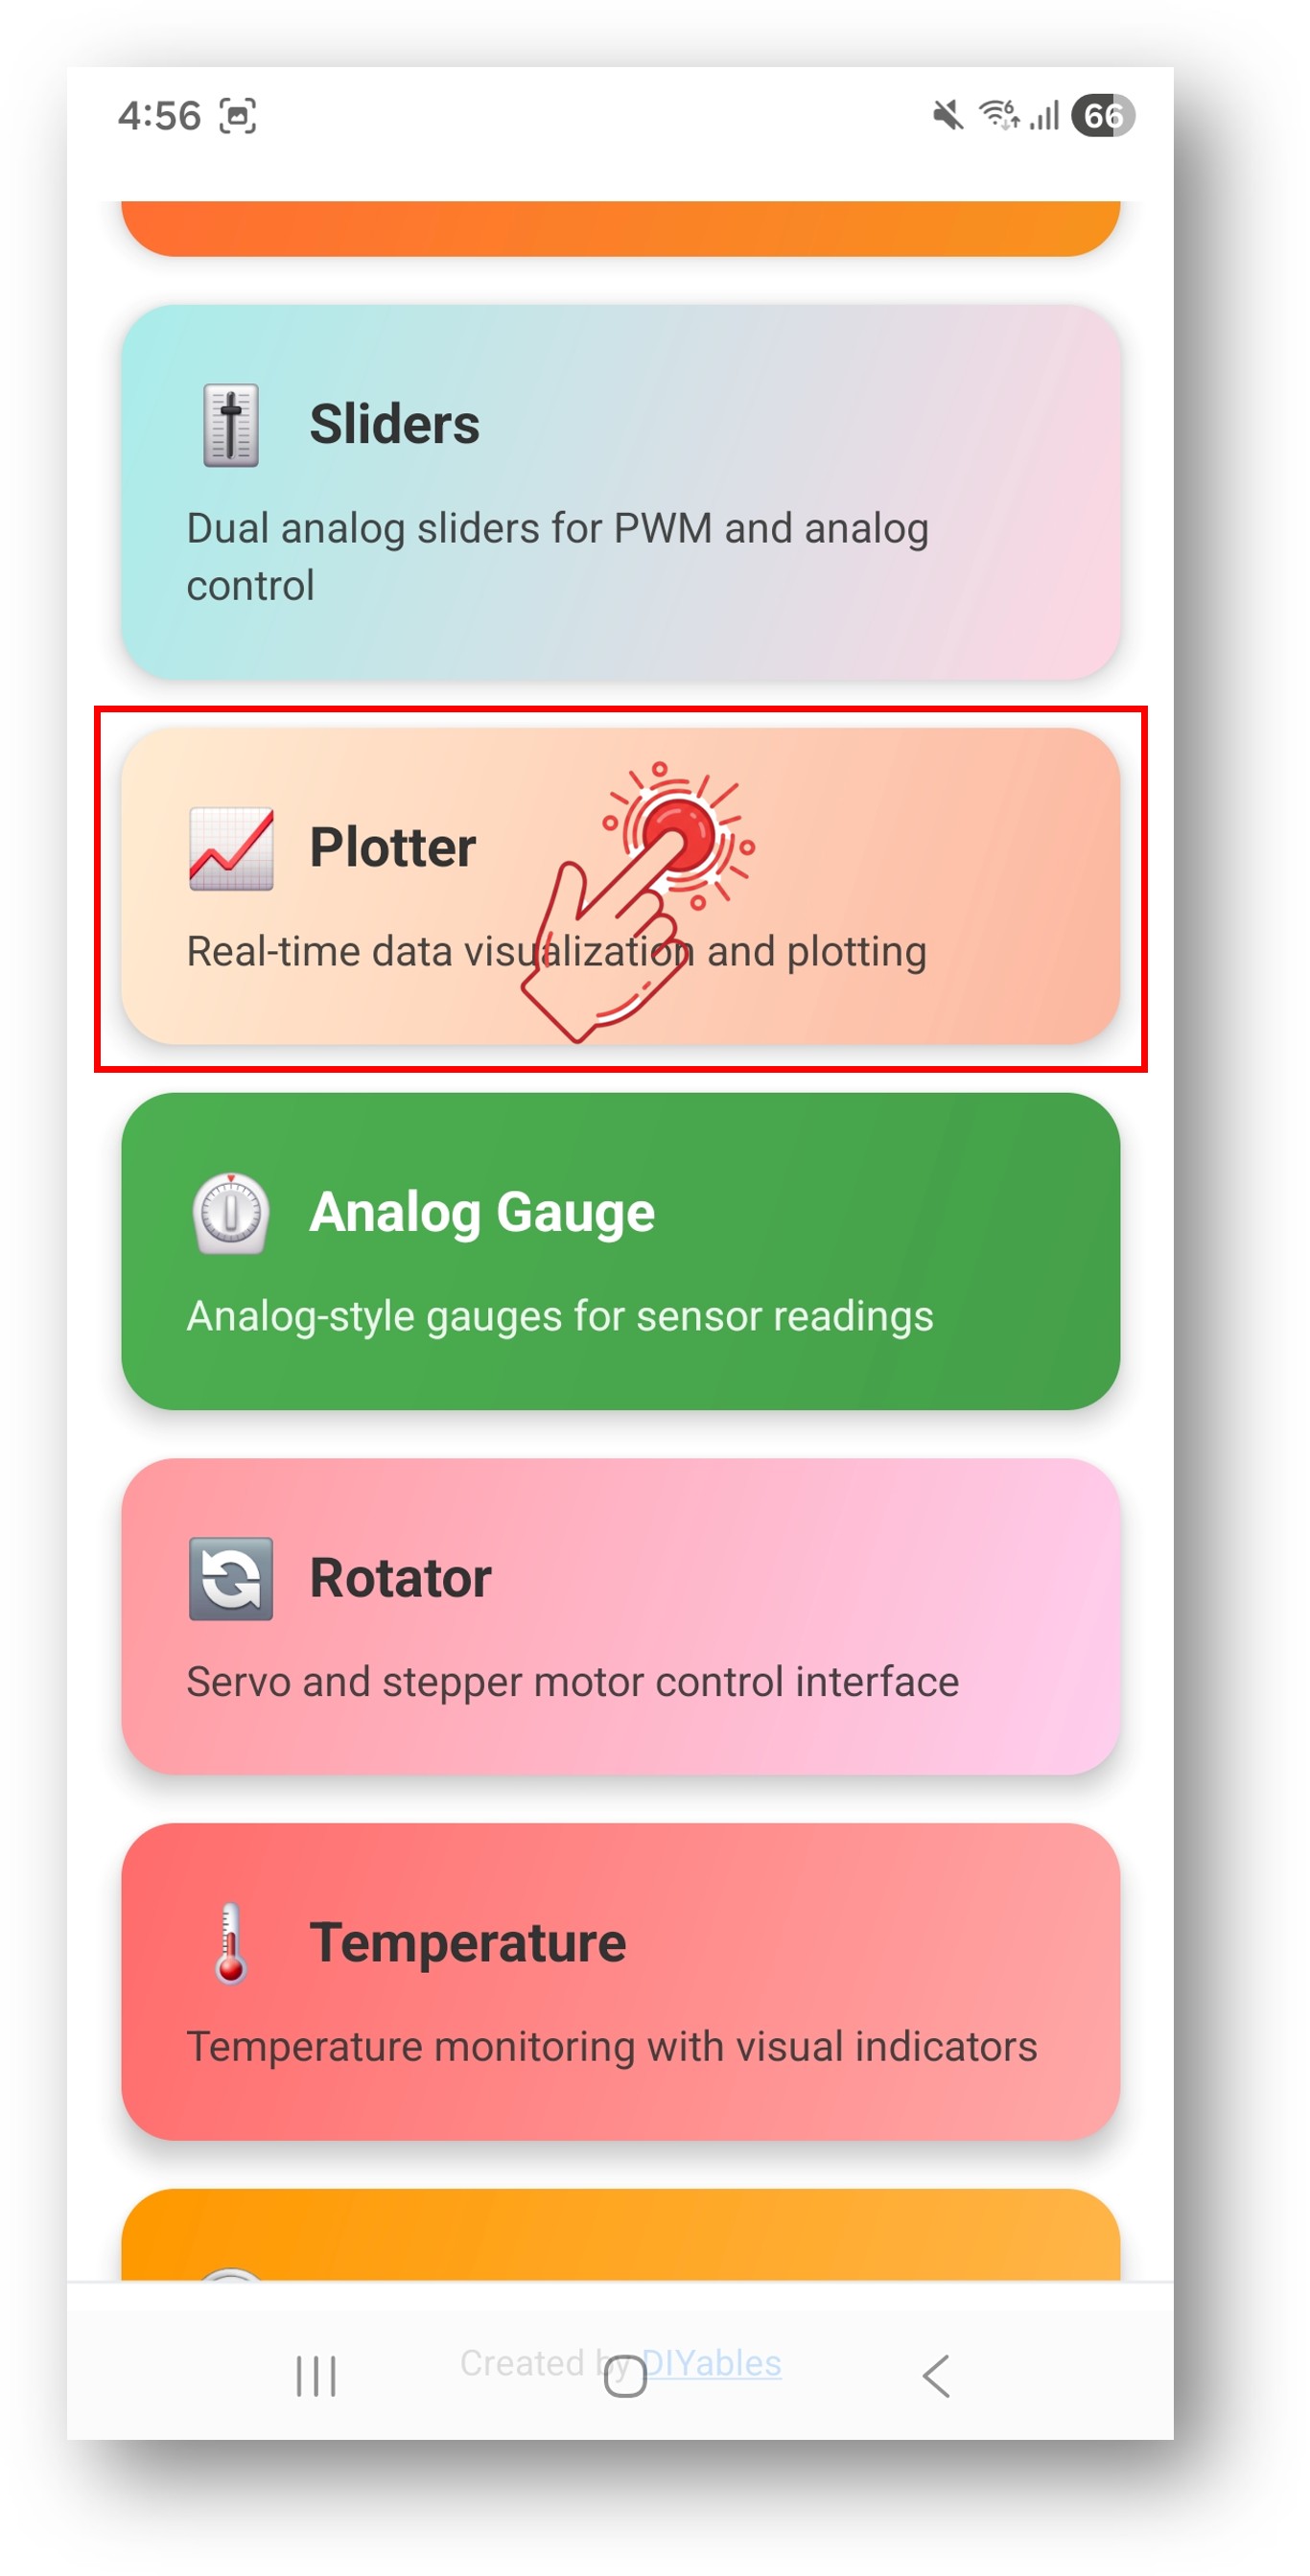
Note: You can tap the settings icon on the home screen to hide/show apps on the home screen. For more details, see the DIYables Bluetooth App User Manual.

  • Watch the real-time data plot scrolling across the screen
DIYables Bluetooth App - Plotter Screen

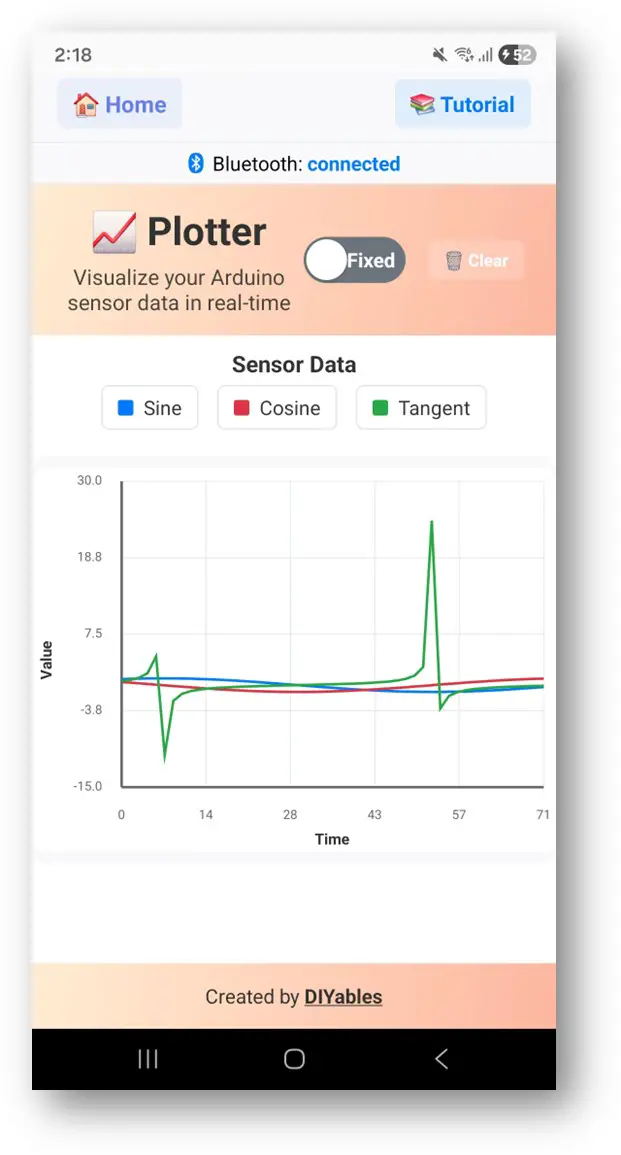
Now look back at the Serial Monitor on Arduino IDE. You will see:

COM6
Send
Bluetooth connected! 0.00 1.00 0.00 0.10 1.00 -0.15 0.20 0.98 0.08 0.29 0.96 -0.22
Autoscroll Show timestamp
Clear output
9600 baud  
Newline  
  • The plotter displays sine, cosine, and random noise waveforms in real time

Creative Customization - Adapt the Code to Your Project

Configure Plot Settings

Set up the plot appearance before connection:

// Set plot title bluetoothPlotter.setPlotTitle("Sensor Data"); // Set axis labels bluetoothPlotter.setAxisLabels("Time", "Value"); // Set fixed Y-axis range bluetoothPlotter.setYAxisRange(-15, 30); // Or enable auto-scaling instead bluetoothPlotter.enableAutoScale(true); // Set number of visible data points bluetoothPlotter.setMaxSamples(100); // Set legend labels for each data series bluetoothPlotter.setLegendLabels("Sine", "Cosine", "Tangent"); // Also supports 1, 2, or 4 labels: // bluetoothPlotter.setLegendLabels("Temperature"); // bluetoothPlotter.setLegendLabels("Temp", "Humidity"); // bluetoothPlotter.setLegendLabels("Ch1", "Ch2", "Ch3", "Ch4");

Send Data to Plotter

Multiple overloads for sending 1 to 4+ data series:

// Send single value bluetoothPlotter.send(25.3); // Send two values (two series) bluetoothPlotter.send(temperature, humidity); // Send three values (three series) bluetoothPlotter.send(sine, cosine, tangent); // Send four values (four series) bluetoothPlotter.send(ch1, ch2, ch3, ch4); // Send array of values (any number of series) float values[] = {1.0, 2.0, 3.0, 4.0, 5.0}; bluetoothPlotter.send(values, 5); // Send as formatted string bluetoothPlotter.send("1.23,4.56,7.89");

Handle Data Request from App

When the app connects and opens the Plotter screen, it may request data:

bluetoothPlotter.onDataRequest([]() { Serial.println("App requested plot data"); // Optionally send initial data point });

Handle Connection Events

bluetoothServer.setOnConnected([]() { Serial.println("Bluetooth connected!"); }); bluetoothServer.setOnDisconnected([]() { Serial.println("Bluetooth disconnected!"); });

How to Use the Plotter

App Interface Controls

The plotter interface in the DIYables Bluetooth App provides:

  • Real-Time Graph: Scrolling line chart with multiple series
  • Legend: Color-coded labels for each data series
  • Auto-Scroll: Continuously scrolls to show latest data

Data Format

Data is sent as comma-separated float values:

  • Single series: bluetoothPlotter.send(value)
  • Multiple series: bluetoothPlotter.send(val1, val2, val3)
  • Data rate: Recommended 10-100ms interval for smooth plotting

Programming Examples

Single Sensor Plot

unsigned long lastPlotTime = 0; const unsigned long PLOT_INTERVAL = 100; // 10 Hz void setup() { bluetoothPlotter.setPlotTitle("Temperature"); bluetoothPlotter.setAxisLabels("Time", "°C"); bluetoothPlotter.setYAxisRange(0, 50); bluetoothPlotter.setLegendLabels("Temperature"); } void loop() { bluetoothServer.loop(); if (millis() - lastPlotTime >= PLOT_INTERVAL) { lastPlotTime = millis(); float temperature = readTemperatureSensor(); bluetoothPlotter.send(temperature); } delay(10); }

Multi-Sensor Accelerometer Plot

#include <Wire.h> #include <MPU6050.h> MPU6050 mpu; unsigned long lastPlotTime = 0; void setup() { Wire.begin(); mpu.initialize(); bluetoothPlotter.setPlotTitle("Accelerometer"); bluetoothPlotter.setAxisLabels("Time", "g"); bluetoothPlotter.setYAxisRange(-2.0, 2.0); bluetoothPlotter.setLegendLabels("X", "Y", "Z"); } void loop() { bluetoothServer.loop(); if (millis() - lastPlotTime >= 50) { // 20 Hz lastPlotTime = millis(); int16_t ax, ay, az; mpu.getAcceleration(&ax, &ay, &az); float gx = ax / 16384.0; float gy = ay / 16384.0; float gz = az / 16384.0; bluetoothPlotter.send(gx, gy, gz); } delay(10); }

Analog Pin Plotter

const int ANALOG_PINS[] = {34, 35, 36, 39}; const int NUM_CHANNELS = 4; void setup() { bluetoothPlotter.setPlotTitle("Analog Inputs"); bluetoothPlotter.setAxisLabels("Time", "ADC Value"); bluetoothPlotter.setYAxisRange(0, 4095); bluetoothPlotter.setMaxSamples(200); bluetoothPlotter.setLegendLabels("A34", "A35", "A36", "A39"); } void loop() { bluetoothServer.loop(); if (millis() - lastPlotTime >= 100) { lastPlotTime = millis(); float values[NUM_CHANNELS]; for (int i = 0; i < NUM_CHANNELS; i++) { values[i] = analogRead(ANALOG_PINS[i]); } bluetoothPlotter.send(values, NUM_CHANNELS); } delay(10); }

Signal Generator

float phase = 0; void setup() { bluetoothPlotter.setPlotTitle("Signal Generator"); bluetoothPlotter.setAxisLabels("Time", "Amplitude"); bluetoothPlotter.setYAxisRange(-1.5, 1.5); bluetoothPlotter.setLegendLabels("Sine", "Square", "Triangle"); } void loop() { bluetoothServer.loop(); if (millis() - lastPlotTime >= 50) { lastPlotTime = millis(); float sine = sin(phase); float square = (sin(phase) > 0) ? 1.0 : -1.0; float triangle = 2.0 * abs(fmod(phase / PI, 2.0) - 1.0) - 1.0; bluetoothPlotter.send(sine, square, triangle); phase += 0.1; if (phase > 2 * PI) phase -= 2 * PI; } delay(10); }

Advanced Programming Techniques

Moving Average Filter

class MovingAverage { float buffer[10]; int index = 0; int count = 0; public: float add(float value) { buffer[index] = value; index = (index + 1) % 10; if (count < 10) count++; float sum = 0; for (int i = 0; i < count; i++) sum += buffer[i]; return sum / count; } }; MovingAverage filter1, filter2; void loop() { bluetoothServer.loop(); if (millis() - lastPlotTime >= 100) { lastPlotTime = millis(); float raw = analogRead(34) * 3.3 / 4095.0; float filtered = filter1.add(raw); // Plot both raw and filtered values bluetoothPlotter.send(raw, filtered); } delay(10); }

Dynamic Plot Configuration

// Change plot settings at runtime void switchToTemperatureMode() { bluetoothPlotter.setPlotTitle("Temperature Monitor"); bluetoothPlotter.setAxisLabels("Time", "°C"); bluetoothPlotter.setYAxisRange(-10, 50); bluetoothPlotter.setLegendLabels("Internal", "External"); } void switchToVoltageMode() { bluetoothPlotter.setPlotTitle("Voltage Monitor"); bluetoothPlotter.setAxisLabels("Time", "°C"); bluetoothPlotter.setYAxisRange(0, 3.3); bluetoothPlotter.setLegendLabels("Ch1", "Ch2", "Ch3"); }

BLE vs Classic Bluetooth - Which to Choose?

FeatureBLE (Esp32BLE_Plotter)Classic Bluetooth (Esp32Bluetooth_Plotter)
iOS Support? Yes? No
Android Support? Yes? Yes
Power ConsumptionLowHigher
Range~30-100m~10-100m
Data RateLowerHigher
Pairing RequiredNo (auto-connect)Yes (manual pairing)
Best ForBattery-powered, cross-platformHigh throughput, Android-only

Troubleshooting

Common Issues

1. Cannot find the device in the app

  • Make sure the ESP32 is powered on and the sketch is uploaded
  • For BLE: Ensure your phone's Bluetooth and Location are enabled
  • For Classic Bluetooth: Pair the device first in phone's Bluetooth settings
  • Check that the correct partition scheme is selected (Huge APP)

2. Plot not updating

  • Check Bluetooth connection status in the app
  • Verify bluetoothPlotter.send() is being called in the loop
  • Check that bluetooth.isConnected() returns true
  • Try disconnecting and reconnecting

3. Plot data looks choppy

  • Reduce the plot interval (e.g., 50ms instead of 500ms)
  • Ensure stable Bluetooth connection
  • Reduce number of data series if bandwidth is limited

4. Y-axis range doesn't fit data

  • Use enableAutoScale(true) for automatic adjustment
  • Or set a wider range with setYAxisRange()

5. Legend labels not showing

  • Call setLegendLabels() before the connection is established
  • Match the number of labels to the number of data series

6. Sketch too large / not enough space

  • In Arduino IDE, go to Tools > Partition Scheme and select "Huge APP (3MB No OTA/1MB SPIFFS)" or "No OTA (Large APP)"
  • The default partition scheme only provides ~1.2MB for app code, which is not enough for Bluetooth libraries
  • This setting gives ~3MB by sacrificing the OTA (over-the-air update) partition

Debug Tips

Add comprehensive debugging:

void debugPlotterData(float v1, float v2, float v3) { Serial.println("=== Plotter Debug ==="); Serial.println("Value 1: " + String(v1, 2)); Serial.println("Value 2: " + String(v2, 2)); Serial.println("Value 3: " + String(v3, 2)); Serial.println("Free Heap: " + String(ESP.getFreeHeap())); Serial.println("====================="); }

Project Ideas

Sensor Monitoring

  • Temperature and humidity trend display
  • Light level monitoring throughout the day
  • Accelerometer motion tracking
  • Pressure sensor data visualization

Signal Analysis

  • Audio frequency visualizer
  • Vibration monitoring
  • Pulse/heart rate display
  • Electromagnetic field strength

Education

  • Sine, cosine, and tangent wave comparison
  • RC circuit charging/discharging curves
  • PID controller response visualization
  • Physics experiment data logger

Industrial

  • Machine vibration monitoring
  • Process variable trending
  • Power consumption tracking
  • Quality control charting

Integration with Other Bluetooth Apps

Combine with Bluetooth Slider

Use sliders to control plotted signal parameters:

float frequency = 1.0; float amplitude = 1.0; bluetoothSlider.onSliderValue([](int slider1, int slider2) { frequency = map(slider1, 0, 100, 1, 20) / 10.0; amplitude = slider2 / 100.0; }); // In loop: float value = amplitude * sin(phase * frequency); bluetoothPlotter.send(value);

Combine with Bluetooth Table

Show current values in table alongside plot:

bluetoothTable.sendValueUpdate("Current", String(currentValue, 2)); bluetoothTable.sendValueUpdate("Max", String(maxValue, 2)); bluetoothTable.sendValueUpdate("Min", String(minValue, 2)); bluetoothTable.sendValueUpdate("Average", String(average, 2));

Next Steps

After mastering the Bluetooth Plotter example, try:

  1. Bluetooth Temperature - For dedicated temperature display
  2. Bluetooth Analog Gauge - For gauge-style visualization
  3. Bluetooth Table - For structured numeric data
  4. Multiple Bluetooth Apps - Combining plotter with other displays

Support

For additional help:

※ OUR MESSAGES