ESP32 - Serial Plotter
This tutorial instructs you how to use Serial Plotter on Arduino IDE with ESP32
Hardware Used In This Tutorial
Or you can buy the following kits:
| 1 | × | DIYables ESP32 Starter Kit (ESP32 included) | |
| 1 | × | DIYables Sensor Kit (18 sensors/displays) |
Introduction to Serial Plotter
The Serial Plotter is a tool on Arduino IDE the can receive data from ESP32 via Serial and plot it on a graph. The Serial Plotter can plot multiple sensor's data in the same screen.
To receive the data from ESP32, It needs to use a micro USB cable between ESP32 and PC
Serial Plotter is composed of two components:
- a selection box: used to select the serial baudrate
- a graph:: a screen that shows the visualized data
- X-axis: presents the time. It has 500 points. The time between each point is the time between two consecutive Serial.println() function calls.
- Y-axis: presents the data values received from ESP32. The Y-axis automatically scales when the data's value increases or decreases.
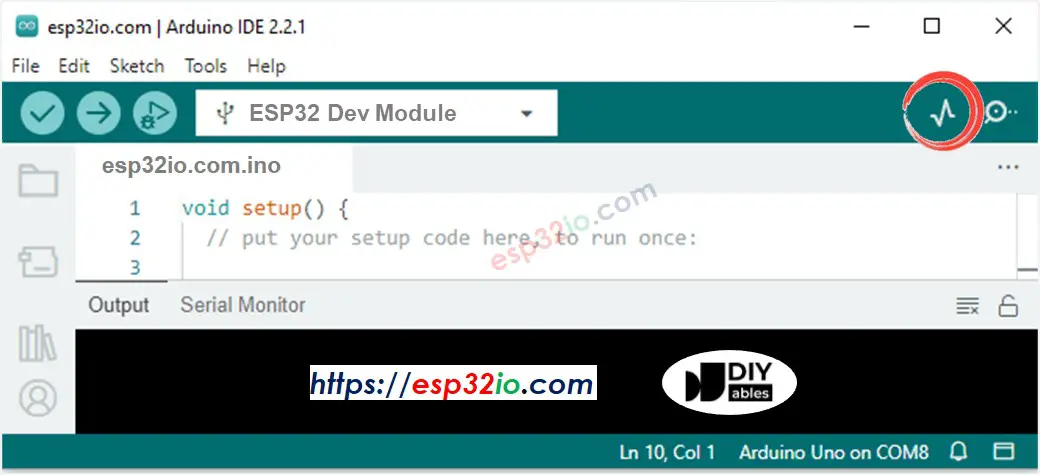
How To Open Serial Plotter
On Arduino IDE, Click the Serial Plotter as below:
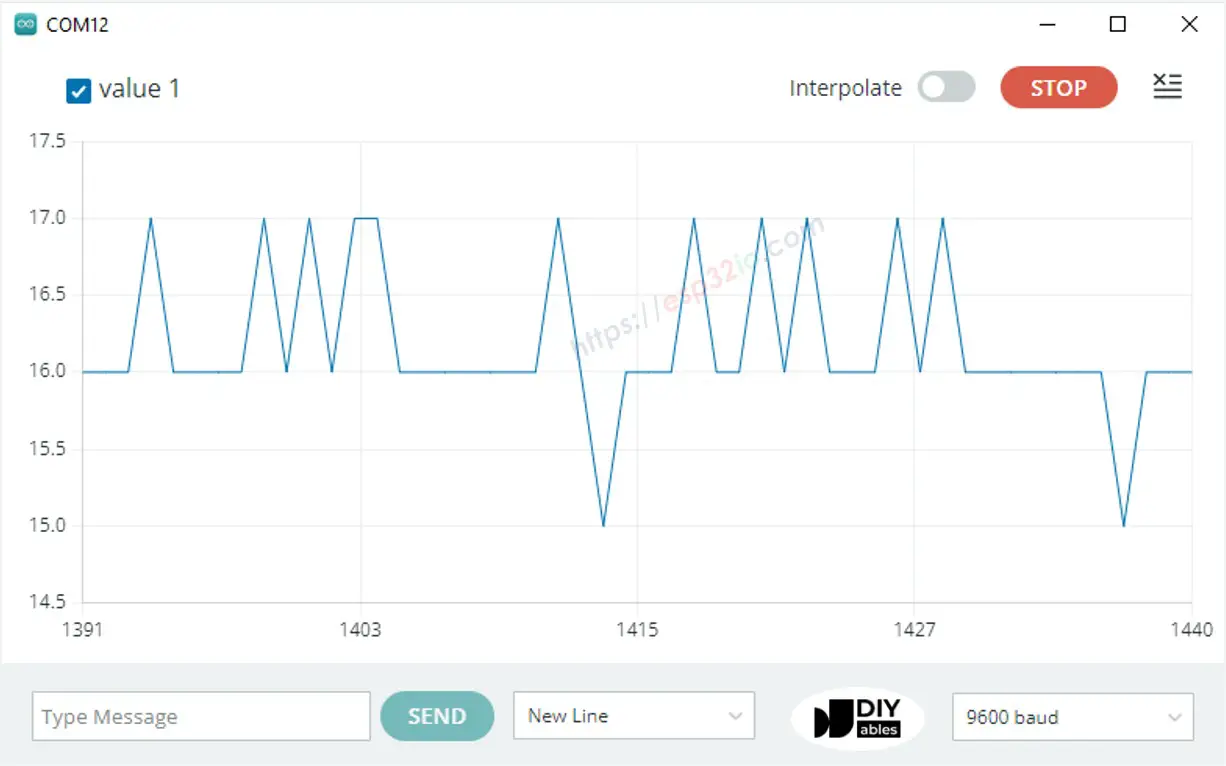
How to plot a Single Line on Graph
To plot a single line on graph, we just need to send the data terminated by “\r\n” character. We can use Serial.println() function
※ NOTE THAT:
Serial.println() automatically appends “\r\n” characters to data.
Example Code
The below ESP32 example code reads the value of an analog input pin and send it to Serial Plotter
Quick Instructions
- If this is the first time you use ESP32, see how to setup environment for ESP32 on Arduino IDE.
- Copy the above code and paste it to Arduino IDE.
- Compile and upload code to ESP32 board by clicking Upload button on Arduino IDE
- Open Serial Plotter
- Select baurate 9600
- See graph on Serial Plotter
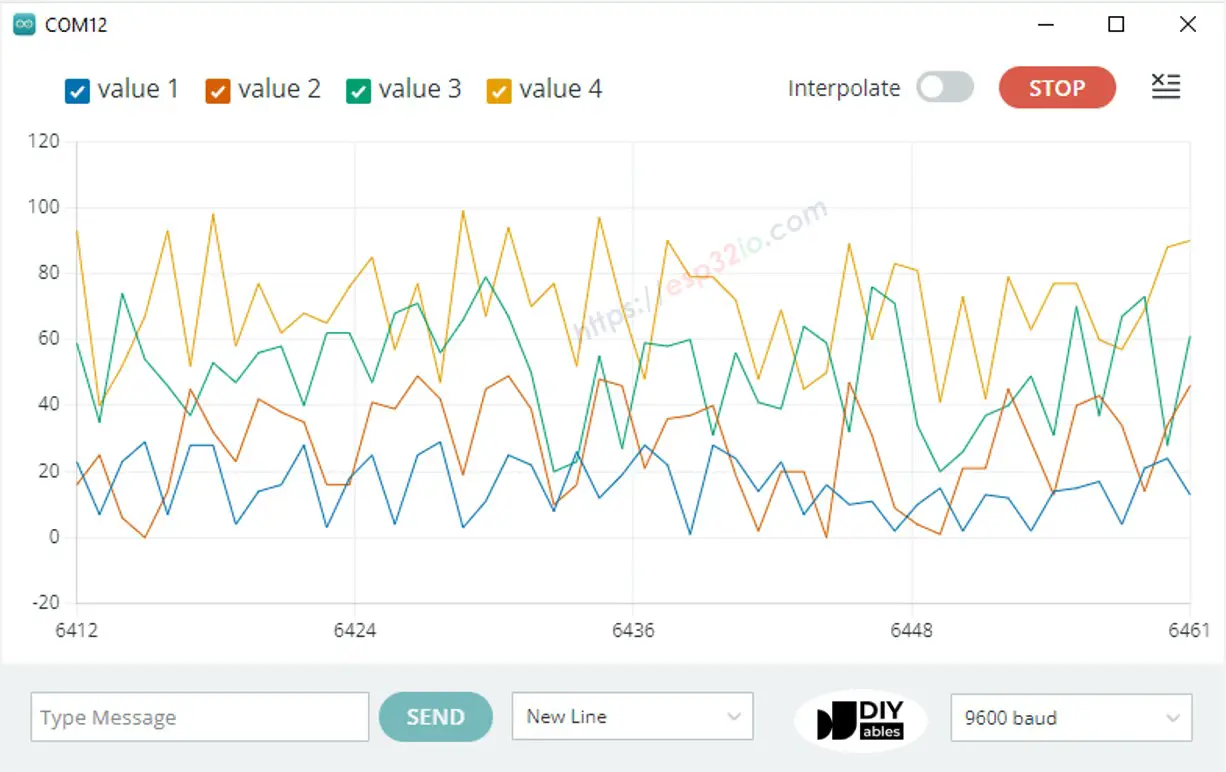
How to plot multiple lines on Graph
To plot multiple variables, we need to separate variables from each other by “\t” or " " character. The last value MUST be terminated by “\r\n” characters.
In detail:
- The first variable
- The middle variables
- The last variable
Example Code
The below ESP32 example code reads the value from 4 analog input pins and sends them to Serial Plotter
The result on Serial Monitor:
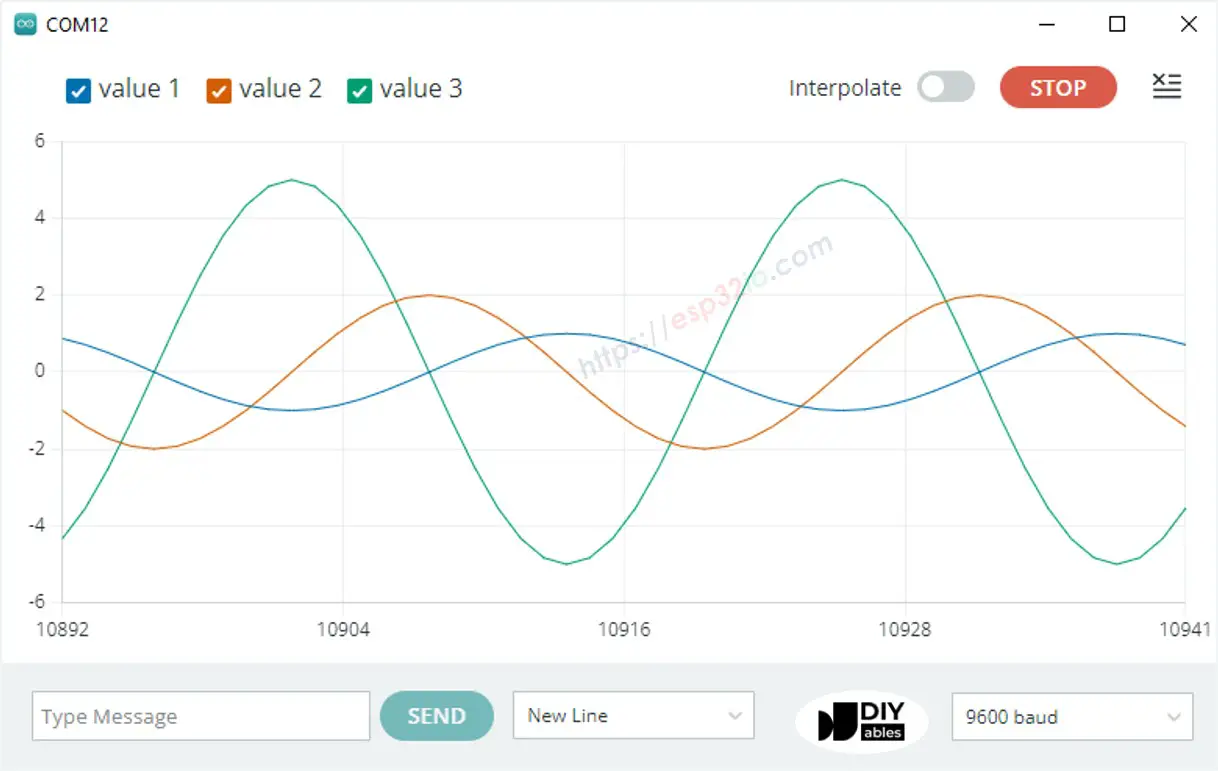
Example of 3 Sine Waveforms
The below ESP32 example code print three sine waveform's value to Serial Plotter
The result on Serial Plotter:
If you want this plotter on the web, check out ESP32 - Web Plotter
Video Tutorial
Making video is a time-consuming work. If the video tutorial is necessary for your learning, please let us know by subscribing to our YouTube channel , If the demand for video is high, we will make the video tutorial.