The WebPlotter example creates a real-time data visualization interface accessible through any web browser. Designed for ESP32 educational platform with enhanced data processing capabilities, real-time plotting features, and seamless integration with sensor monitoring systems. Perfect for visualizing sensor data, debugging algorithms, or monitoring system performance in real-time.
Watch this step-by-step video tutorial demonstrating how to use a DHT sensor with the Web Plotter app:
Features
Real-time Data Plotting: Visualize sensor data as it streams from Arduino
Multiple Data Series: Plot up to 8 different data streams simultaneously
Auto-scaling: Automatic Y-axis scaling based on data range
Interactive Interface: Zoom, pan, and analyze data trends
WebSocket Communication: Instant updates with minimal latency
Responsive Design: Works on desktop, tablet, and mobile devices
Customizable Configuration: Adjustable plot titles, axis labels, and ranges
Disclosure: Some of the links in this section are Amazon affiliate links, meaning we may earn a commission at no additional cost to you if you make a purchase through them. Additionally, some links direct you to products from our own brand, DIYables .
Click Upload button on Arduino IDE to upload code to ESP32
Open the Serial Monitor
Check out the result on Serial Monitor. It looks like the below
Newbiely | Arduino IDE 2.3.8
──
☐
✕
File
Edit
Sketch
Tools
Help
ESP32 Dev Module
Newbiely.ino
···
8Serial.println("Hello World!");
Output
Serial Monitor
Message (Enter to send message to 'ESP32 Dev Module' on 'COM15')
New Line
9600 baud
DIYables WebApp - Web Plotter Example
INFO: Added app /
INFO: Added app /web-plotter
DIYables WebApp Library
Platform: ESP32
Network connected!
IP address: 192.168.0.2
HTTP server started on port 80
Configuring WebSocket server callbacks...
WebSocket server started on port 81
WebSocket URL: ws://192.168.0.2:81
WebSocket server started on port 81
==========================================
DIYables WebApp Ready!
==========================================
📱 Web Interface: http://192.168.0.2
🔗 WebSocket: ws://192.168.0.2:81
📋 Available Applications:
🏠 Home Page: http://192.168.0.2/
📊 Web Plotter: http://192.168.0.2/web-plotter
==========================================
Ln 11, Col 1
ESP32 Dev Module on COM15
2
If you do not see anything, reboot ESP32 board.
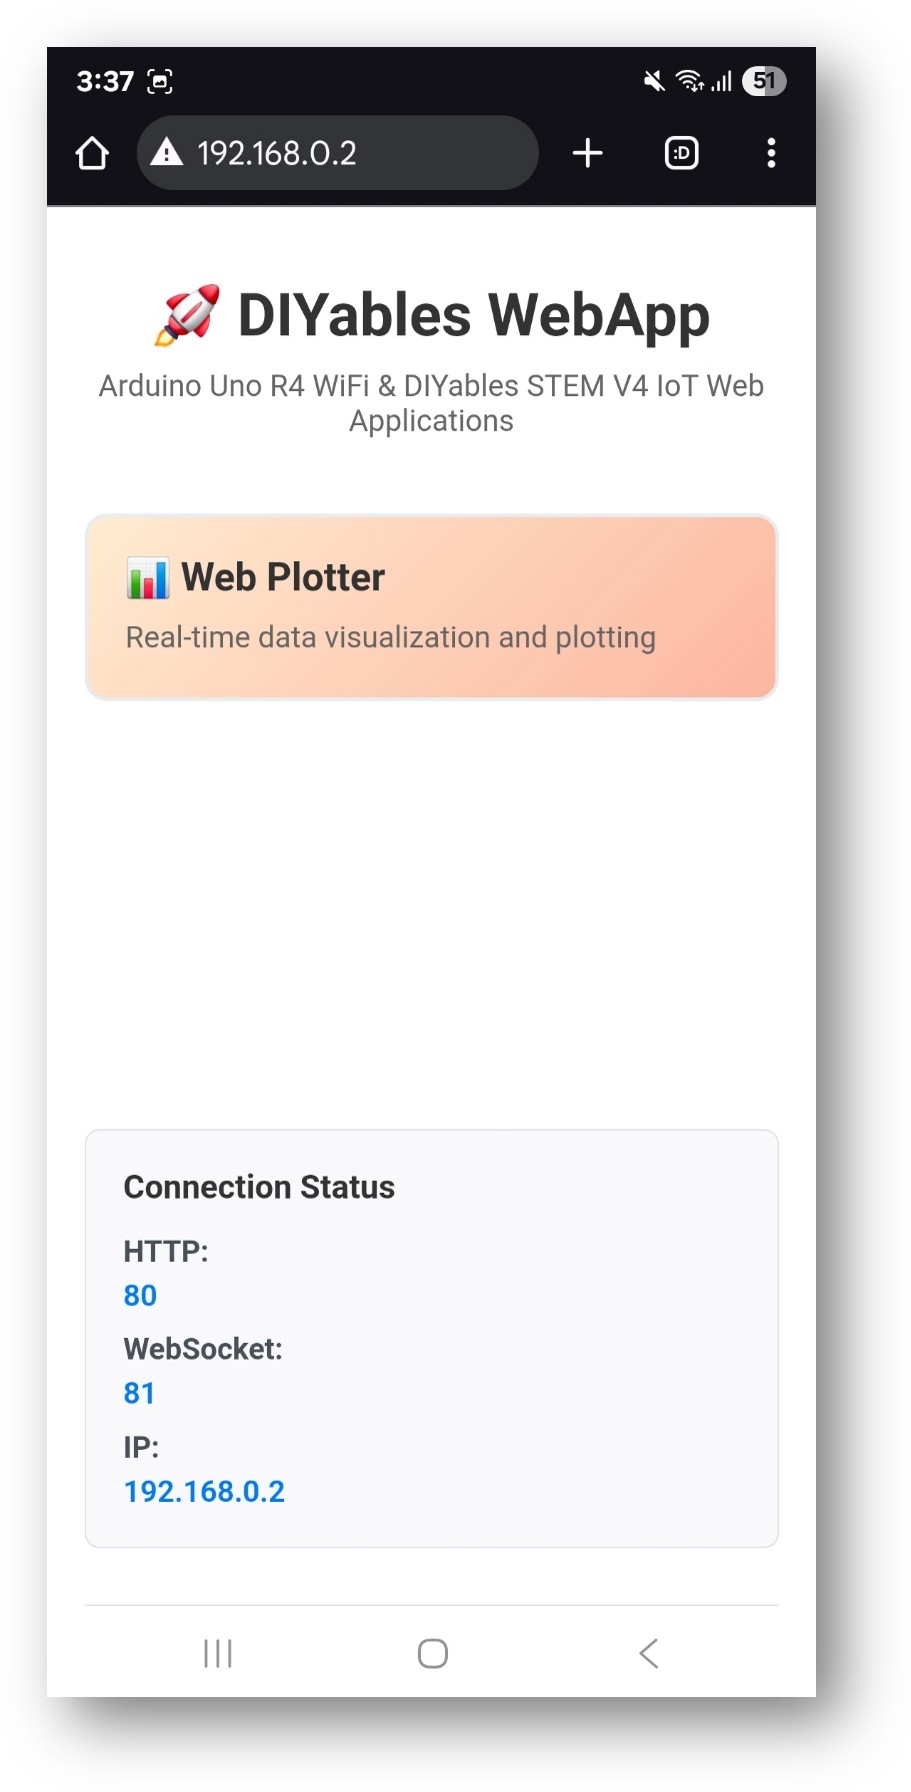
Take note of the IP address displayed, and enter this address into the address bar of a web browser on your smartphone or PC.
Example: http://192.168.0.2
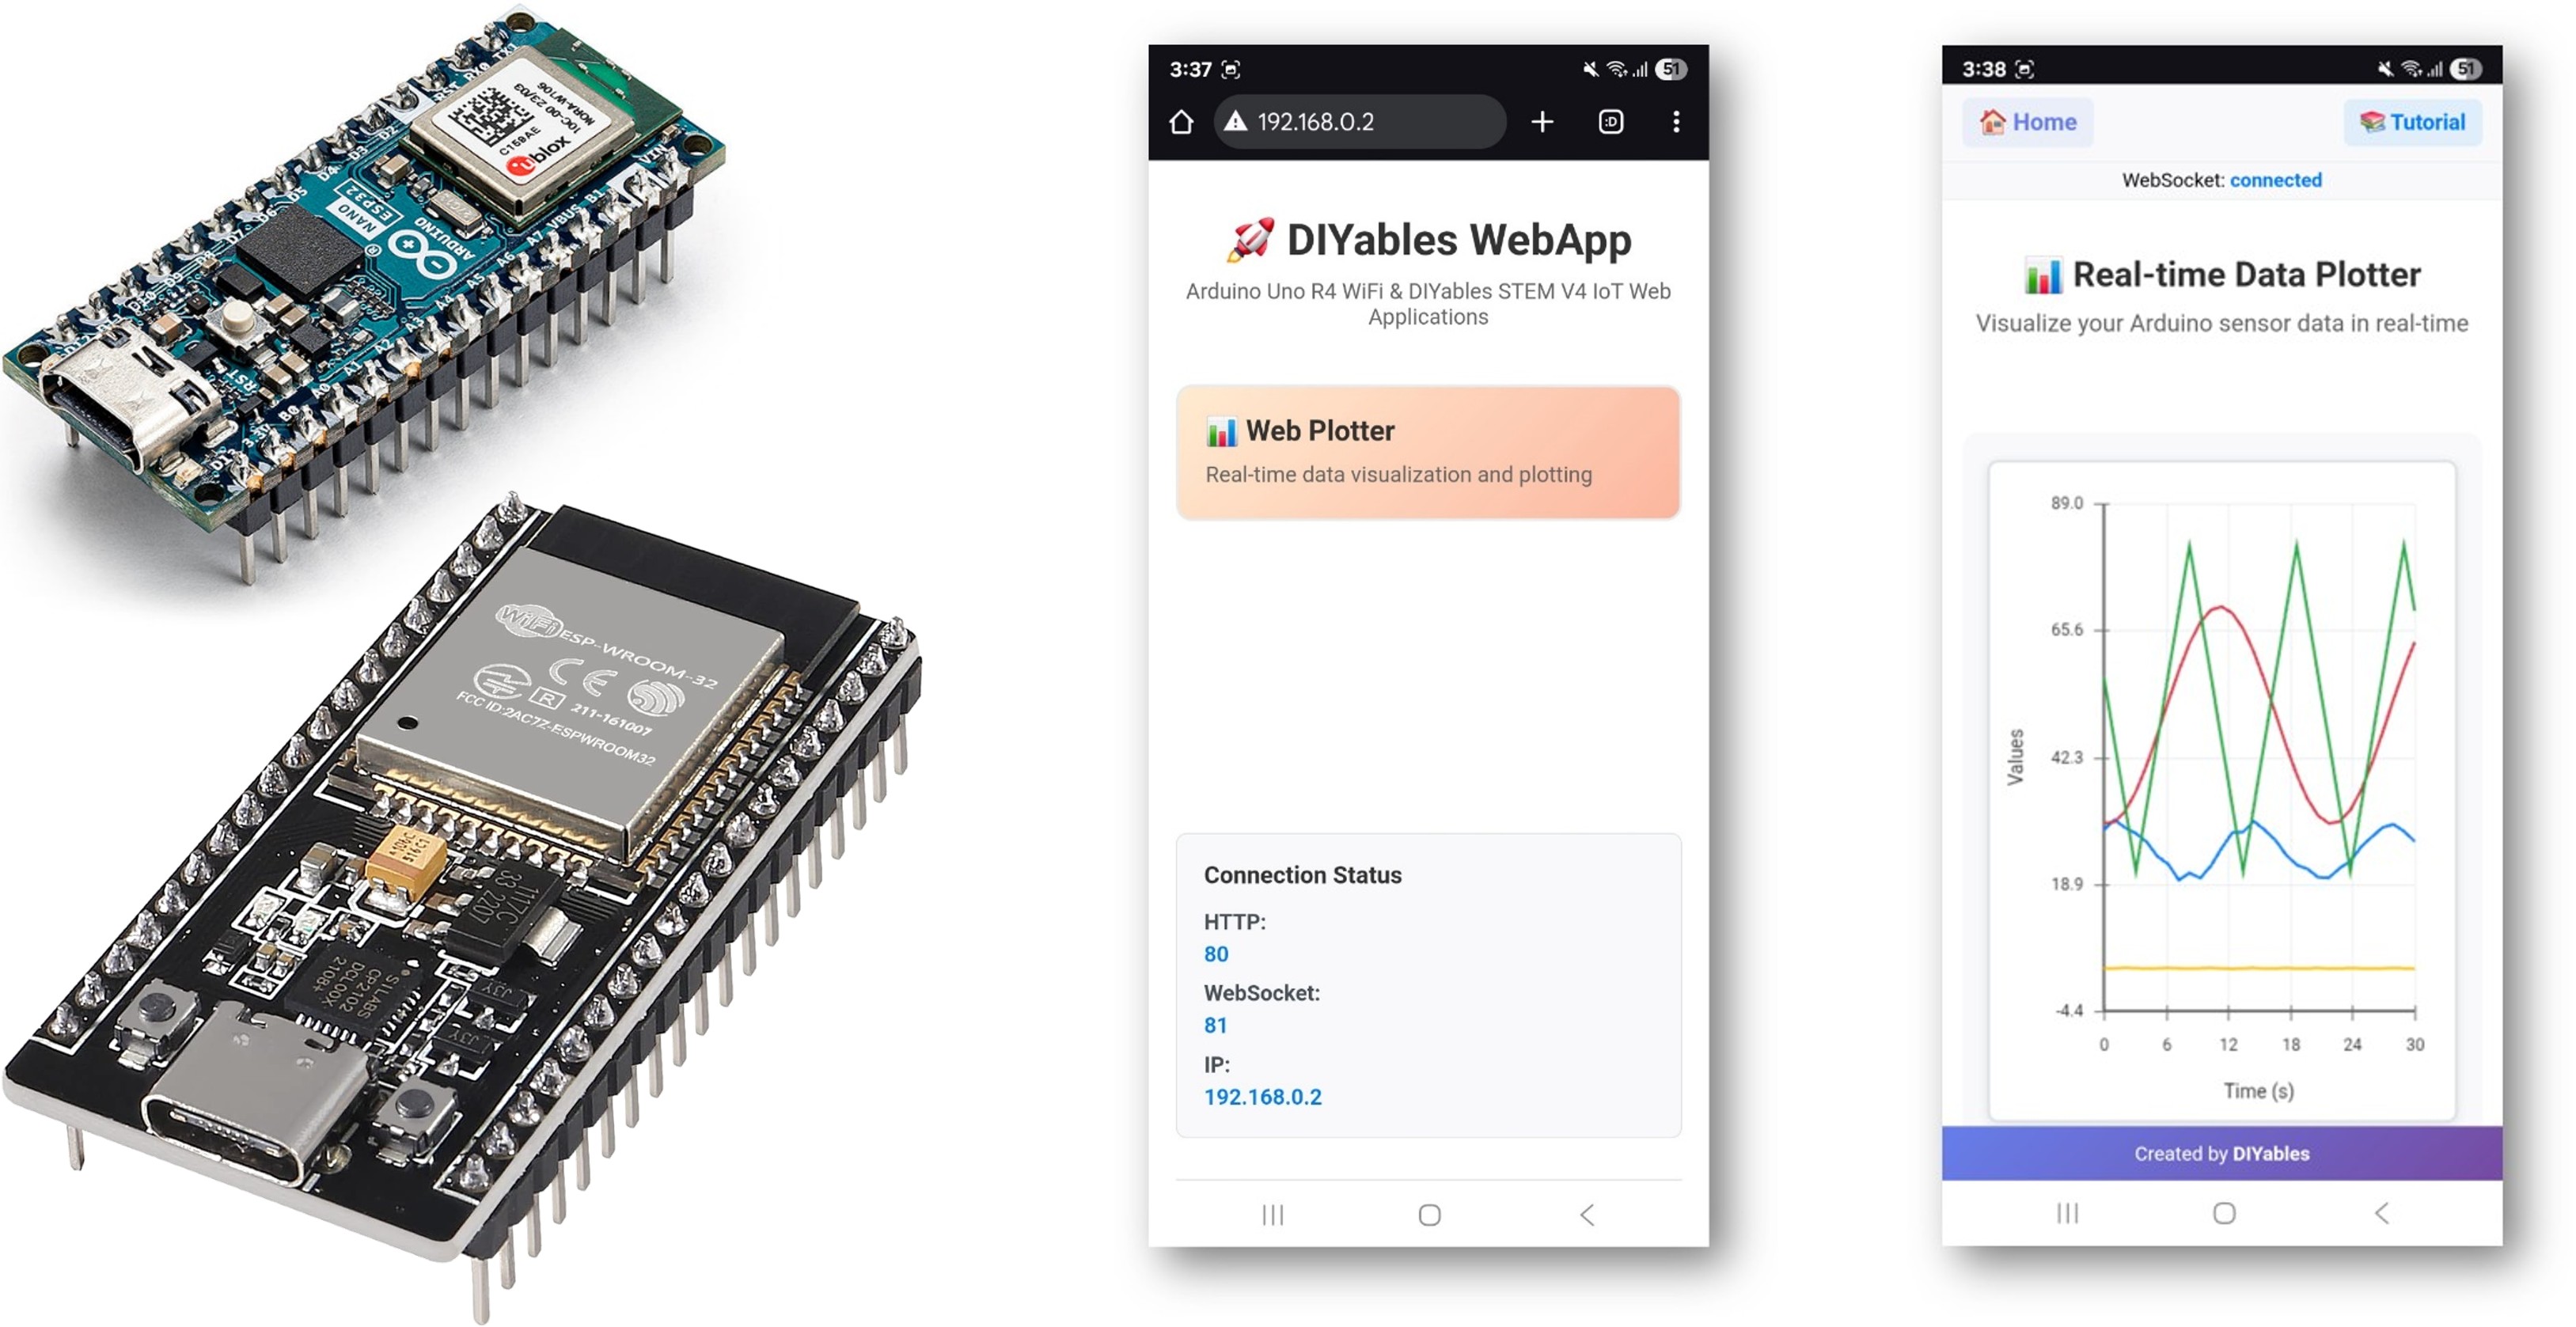
You will see the home page like below image:
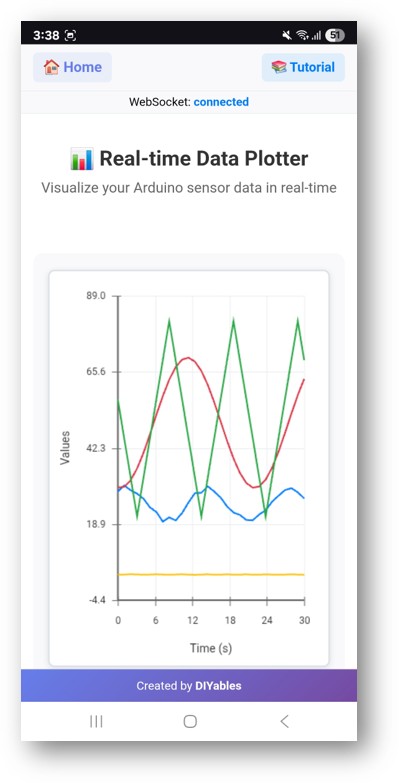
Click to the Web Plotter link, you will see the Web Plotter app's UI like the below:
Or you can also access the page directly by IP address followed by /web-plotter. For example: http://192.168.0.2/web-plotter
Watch as the ESP32 generates simulated sensor data and plots it in real-time. You'll see multiple colored lines representing different data streams.
Creative Customization - Visualize Your Data Creatively
Transform the plotting interface to match your unique project requirements and create stunning data visualizations:
Data Source Configuration
Replace simulated data with real sensor readings:
Method 1: Single Sensor Reading
void sendTemperatureData() {float temperature = analogRead(A0) * (5.0 / 1023.0) * 100; // LM35 temperature sensor webPlotterPage.sendPlotData(temperature);}
float movingAverage(float newValue) {staticfloat readings[10];staticint index = 0;staticfloat total = 0; total -= readings[index]; readings[index] = newValue; total += readings[index]; index = (index + 1) % 10;return total / 10.0;}void sendFilteredData() {float rawValue = analogRead(A0);float filteredValue = movingAverage(rawValue); webPlotterPage.sendPlotData(rawValue / 10.0, filteredValue / 10.0);}
Data Logging with Timestamps
void sendTimestampedData() {unsignedlong currentTime = millis() / 1000;float sensorValue = analogRead(A0) / 10.0;// Send time and value as separate data series webPlotterPage.sendPlotData(currentTime, sensorValue);// Also log to Serial for debuggingSerial.print("Time: ");Serial.print(currentTime);Serial.print("s, Value: ");Serial.println(sensorValue);}
Please feel free to share the link of this tutorial. However, Please do not use our content on any other websites. We invested a lot of effort and time to create the content, please respect our work!